Best time to visit Gold Coast
Re-score for me — drag the dial — every chart recolours live for your heat & sea limits 27°C · sea 29°C
Default 27 °C is the upper edge of the Holiday Climate Index "ideal comfort" band (Scott, Rutty, Amelung & Tang, 2016). Above this, most warm-tourism travellers report measurable discomfort.
Default 29 °C is the Beach Climate Index "bathtub" line (Morgan et al.) — where the sea stops being refreshing and starts feeling like a warm bath.
Greyed factors are scored normally — extreme heat overrides them, so a clear sky or low rain can't lift the period.
How is this scored? HCI / Steadman / CCI gate — full methodology and citations below.
Compare with another destination
Add as many as you like — stacked below the main strips above. Each row is just the recent-window score strip and (for beach destinations) sea-temperature strip.
Tours in Gold Coast
30 top-rated tours via Viator. Booking links earn this site a commission at no cost to you. Map locations are approximate (centred on Gold Coast).
- 1
 Surfers Paradise Sightseeing Sunset River Cruise
 - 2
 Gold Coast Whale Watching Cruise
 - 3
 Mount Tamborine Wine Tasting Tour from Brisbane or the Gold Coast
 - 4
 1hr Jet Ski Safari
 - 5
 Snorkel with Turtles Gold Coast
 - 6
 Surf Lesson on the Gold Coasts locals Favourite beach (Ages 14+)
 - 7
 Gold Coast Island Private Cruise
 - 8
 Gold Coast Parasailing – Tandem & Triple Flights
 - 9
 2 Hour Surf Lesson At The Spit, Main Beach (Ages 14+)
 - 10
 Gold Coast Buffet Dinner Sightseeing Cruise
 - 11
 Gold Coast Boat Hire Self-Drive with No License Required
 - 12
 Jet Ski Safaris - 30 Minute Jet Ski Hire
 - 13
 Kids Only Surf Lessons at The Spit, Main Beach (Ages 6- 13)
 - 14
 Gold Coast Hot Air Balloon Flight
 - 15
 Gold Coast's Broadwater Private Calm Water Fishing
 - 16
 Gold Coast Tandem Skydive
 - 17
 2 Hour Ultimate Learn to Surf Adventure
 - 18
 1.5 hr Jet Ski Safari tour to South Stradbroke Island!
 - 19
 Whale Watching Tour with Spirit of Gold Coast
 - 20
 Whale Watching by Sea World Cruises
 - 21
 2.5 hr Jet Ski Safaris tour - Ultimate Adventure + island stop
 - 2230 min Jet Ski Safari
- 23
 Gold Coast 2 hour Sunset Sailing Cruise with Drinks&Tasting Plate
 - 24
 Gold Coast Buffet Lunch Sightseeing Cruise
 - 25
 Gold Coast Kayaking & Snorkelling Tour (2.5 Hours)
 - 26
 Hot Air Balloon Flight Brisbane with Vineyard Breakfast
 - 27
 Full-Day Guided Wine Tour in Mt Tamborine From Gold Coast
 - 28
 Gold Coast 2 Hr Sunset PRIVATE Sailing Charter with Drinks & Food
 - 29
 Gold Coast Skippered Canal Cruise
 - 30
 Tamborine Mountain Distillery Cocktail Masterclass
Last refreshed 2026-08-13.
Similar climatesByron Bay91% · Sydney89% · Townsville86%
Other destinations with the most-alike year-round climate to Gold Coast (apparent temperature, rain hours, sunshine — matched within the same trip-profile). The ±N chip compares each match's typical score for the current month against Gold Coast's. Based on the 2020-2024 climatology, not this year's actual weather.
Month-by-month
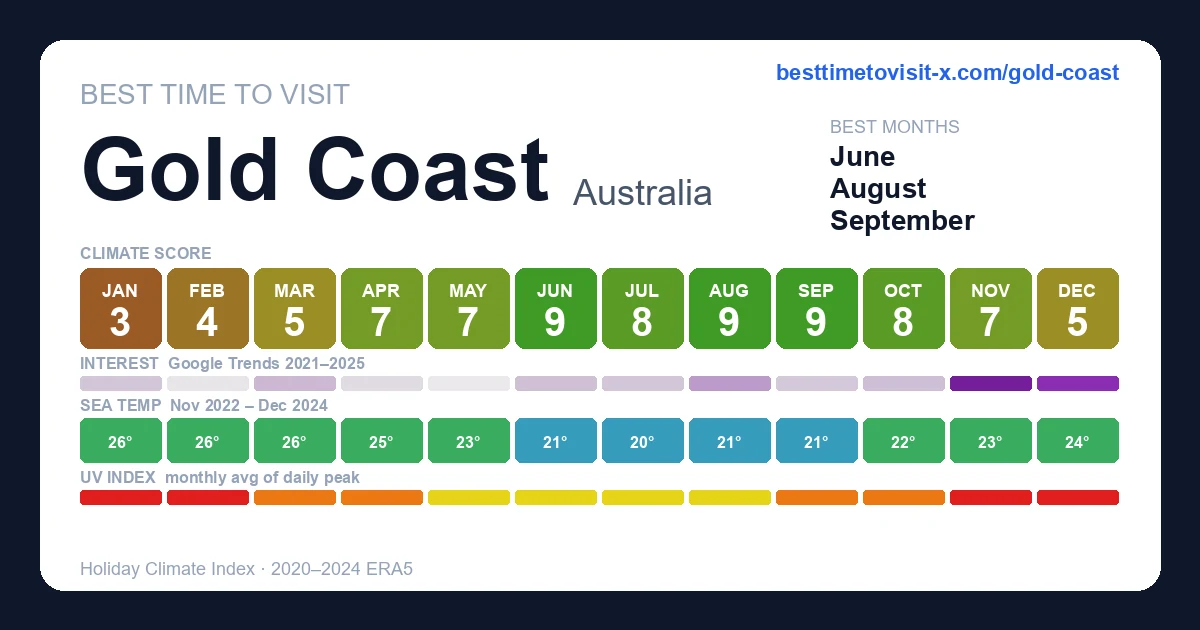
| Month | Temp °C | Feels °C | Rain days | Rain h | Rain h/day | Humidity | Wind km/h | Sun h | UV | Interest | Score |
|---|---|---|---|---|---|---|---|---|---|---|---|
| Jan | 22–27 | 29 | 19 | 273 | 14.4 | 70% | 20 | 259 | 10 | Busy | 3 |
| Feb | 22–27 | 29 | 16 | 257 | 16.1 | 69% | 20 | 213 | 10 | Quiet | 4 |
| Mar | 21–27 | 28 | 17 | 230 | 13.5 | 69% | 20 | 226 | 8 | Busy | 5 |
| Apr | 18–25 | 25 | 12 | 168 | 14.0 | 63% | 19 | 224 | 6 | Quiet | 7 |
| May | 15–22 | 21 | 10 | 154 | 15.4 | 64% | 19 | 205 | 4 | Quiet | 7 |
| Jun | 13–21 | 19 | 5 | 58 | 11.6 | 56% | 16 | 206 | 3 | Moderate | 9 |
| Jul | 12–20 | 19 | 8 | 111 | 13.9 | 58% | 18 | 197 | 4 | Busy | 8 |
| Aug | 13–22 | 21 | 6 | 75 | 12.5 | 55% | 18 | 229 | 5 | Moderate | 9 |
| Sep | 15–24 | 22 | 8 | 97 | 12.1 | 55% | 21 | 237 | 6 | Quiet | 9 |
| Oct | 17–25 | 25 | 11 | 132 | 12.0 | 60% | 21 | 253 | 8 | Quiet | 8 |
| Nov | 19–26 | 26 | 12 | 168 | 14.0 | 63% | 21 | 239 | 9 | Moderate | 7 |
| Dec | 21–27 | 29 | 15 | 193 | 12.9 | 67% | 21 | 259 | 10 | Peak | 5 |
UV Index in Gold Coast by Month
UV index in Gold Coast peaks at 10 (very high) in January, dropping to 3 (moderate) in June. January, February, November, December reach very high or extreme levels — apply SPF 50+, wear a hat and protective clothing, and limit direct sun between 11:00 and 17:00.
Best months in detail
June
9/1013–21°C (feels 19°C) · 5 rain days (58h) · 206 sun hours · 56% humidity · Moderate crowd · UV 3 (moderate)
August
9/1013–22°C (feels 21°C) · 6 rain days (75h) · 229 sun hours · 55% humidity · Moderate crowd · UV 5 (moderate) · sunniest 1 in 10 days reach 7 (high)
September
9/1015–24°C (feels 22°C) · 8 rain days (97h) · 237 sun hours · 55% humidity · Quiet crowd · UV 6 (high) · sunniest 1 in 10 days reach 8 (very high)
Every month
Show the other 9 months in detail
January
3/1022–27°C (feels 29°C) · 19 rain days (273h) · 259 sun hours · 70% humidity · Busy crowd · UV 10 (very high) · sunniest 1 in 10 days reach 13 (extreme)
February
4/1022–27°C (feels 29°C) · 16 rain days (257h) · 213 sun hours · 69% humidity · Quiet crowd · UV 10 (very high) · sunniest 1 in 10 days reach 12 (extreme)
March
5/1021–27°C (feels 28°C) · 17 rain days (230h) · 226 sun hours · 69% humidity · Busy crowd · UV 8 (high) · sunniest 1 in 10 days reach 10 (very high)
April
7/1018–25°C · 12 rain days (168h) · 224 sun hours · 63% humidity · Quiet crowd · UV 6 (high) · sunniest 1 in 10 days reach 8 (high)
May
7/1015–22°C · 10 rain days (154h) · 205 sun hours · 64% humidity · Quiet crowd · UV 4 (moderate)
July
8/1012–20°C (feels 19°C) · 8 rain days (111h) · 197 sun hours · 58% humidity · Busy crowd · UV 4 (moderate)
October
8/1017–25°C · 11 rain days (132h) · 253 sun hours · 60% humidity · Quiet crowd · UV 8 (high) · sunniest 1 in 10 days reach 10 (very high)
November
7/1019–26°C · 12 rain days (168h) · 239 sun hours · 63% humidity · Moderate crowd · UV 9 (very high) · sunniest 1 in 10 days reach 12 (extreme)
December
5/1021–27°C (feels 29°C) · 15 rain days (193h) · 259 sun hours · 67% humidity · Peak crowd · UV 10 (very high) · sunniest 1 in 10 days reach 12 (extreme)
Winter is the season here, because of the whales
The Gold Coast reverses the usual Australian logic. Its cool season is one of its main draws, because humpback whales pass directly offshore. The migration runs from roughly late May or early June to early November — the longest continuous whale-watching season in Australia — as the animals travel north from Antarctic waters to breed, then return south with calves.
The two legs look different. June and July bring fast-moving northbound animals and frequent surface displays; the later months bring mothers with calves moving slowly, closer inshore. July and August are generally the busiest weeks on the migration.
That means June to September — the months a climate score marks down for cooler water — carry the region's most distinctive experience, with mild dry days and far fewer people than the summer peak.
Sources: WWF Australia — whale watching season and spots , Experience Gold Coast — whale watching guide
What is the best month to go to the Gold Coast?
It depends what for. June to September for whales, mild dry weather and low humidity. December to February for warm swimming, at the cost of humidity, storms and peak crowds. September is a strong compromise — whales still passing, water warming up.
What is the rainy season on the Gold Coast?
Roughly December to March, the summer wet season, peaking in February at around 140 mm. Rain usually arrives as intense afternoon and evening storms rather than all-day cloud, so beach mornings often survive intact. Winter is markedly drier — July averages about 34 mm — and this period also overlaps the Australian cyclone season.
What is the cheapest time to go to the Gold Coast?
May and the first half of June, and again late October to November — between the Australian school holidays and outside the summer peak. Both windows keep mild, dry weather, since winter here is sunny rather than cold, with July lows around 13C. You are trading warm swimming water rather than trading away decent conditions.
What is the coldest month on the Gold Coast?
July, with lows around 13C and daytime highs still pleasantly mild — winter here is dry and sunny rather than cold, and it is also the driest month at about 34 mm. Locals swim year-round; visitors from cooler climates find the winter sea brisk but perfectly usable.
Is the Gold Coast warm all year?
Effectively yes. This is a subtropical climate with January highs near 27C and July lows around 13C — a narrow annual range by most standards. The meaningful seasonal variable is rain, not temperature: February averages about 140 mm against July's 34 mm.
Is the Gold Coast hotter than Sydney?
Warmer and more consistent, yes. The Gold Coast sits several hundred kilometres north in a subtropical zone, so its winters are markedly milder than Sydney's and its humidity higher in summer. Sydney has the greater seasonal swing; the Gold Coast has the more reliable beach weather year-round.
Which is better to visit, Brisbane or Gold Coast?
The Gold Coast for beaches, theme parks and the hinterland rainforest; Brisbane for city culture, galleries and as a base for Moreton Bay. They are about an hour apart, so many trips include both. If your priority is surf and sand, base yourself on the coast and day-trip into the city.
What is the Gold Coast famous for?
Around 57 km of surf beaches, of which Surfers Paradise is the best known, and Australia's biggest concentration of theme parks. Less obviously, the hinterland behind the strip holds Lamington and Springbrook National Parks — subtropical rainforest with waterfalls, about an hour inland and a complete contrast to the coast.
What not to miss on the Gold Coast?
Burleigh Heads for the headland walk and a calmer beach than Surfers Paradise, the hinterland rainforest at Springbrook or Lamington with its glow-worm caves, and a whale-watching trip between roughly June and October, when humpbacks pass close to shore on their migration.
Which is better, the Gold Coast or Cairns?
Cairns is the base for the Great Barrier Reef and the Daintree rainforest, so it wins decisively if reef diving is the point of the trip. The Gold Coast is about surf beaches, theme parks and a subtropical city, with easier access from Brisbane. Cairns is tropical with a distinct wet season; the Gold Coast is milder year-round.
Frequently asked questions about visiting Gold Coast
When is the best time to visit Gold Coast?
June is the highest-scoring month (9/10 on the Holiday Climate Index). Typical conditions: 13–21°C (5 rainy days). The top three months by score are June, August, September.
What is the worst time to visit Gold Coast?
January is the lowest-scoring month (3/10). Typical conditions: 22–27°C (19 rainy days).
When are crowds lowest in Gold Coast?
Search-interest seasonality (Google Trends 2021-2025) is lowest in May and peaks in December. Interest tracks both in-trip visitors and lead-time planners, so treat it as a "destination is on people's minds" signal rather than literal arrivals.
Which months in Gold Coast have good weather but fewer tourists?
June (climate 9/10, crowd index 43) and September (climate 9/10, crowd index 29) — shoulder months with above-average climate and below-median search-interest. Often the best value-for-weather trade.
What is the UV index in Gold Coast by month?
UV peaks at 10 (very high) in January and is lowest in June at 3 (moderate). Monthly peak values: Jan 10, Feb 10, Mar 8, Apr 6, May 4, Jun 3, Jul 4, Aug 5, Sep 6, Oct 8, Nov 9, Dec 10. January, February, November, December reach very high or extreme levels — apply SPF 50+, wear a hat and protective clothing, and limit direct sun between 11:00 and 17:00.
What is the UV index in Gold Coast in January?
January is the peak UV month in Gold Coast, with a daily-peak UV index of 10 (very high). At this level, sunburn can occur in under 20 minutes on unprotected fair skin. Apply SPF 50+, wear protective clothing and a hat, and avoid direct midday sun (11:00–17:00).
How high can UV get in Gold Coast on the sunniest days?
Most days look like the monthly average, but on the sunniest ~1 in 10 days UV climbs higher than the mean suggests. January is the worst case: typical days average UV 10 (very high), but the top 10% of days reach UV 13 (extreme) — and even higher. Months where the sunniest days routinely exceed the typical reading: January, February, March, April, August, September, October, November, December. Plan sun protection for the worst case, not the average.