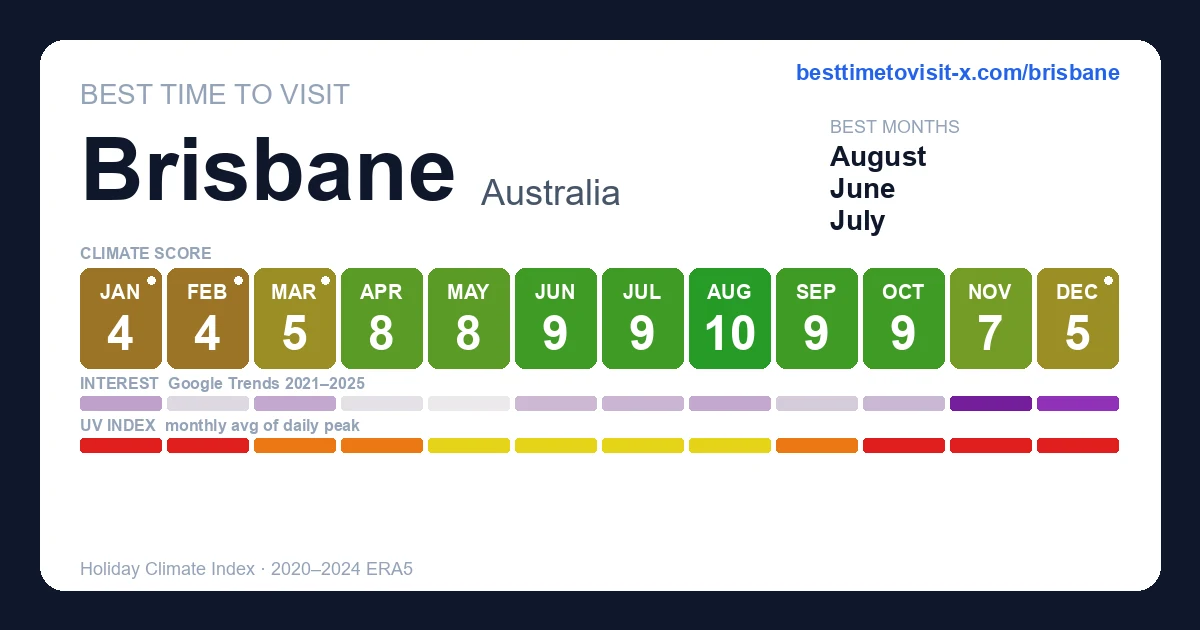
Best time to visit Brisbane
Re-score for me — drag the dial — every chart on the page recolours live for your heat limit 27°C
Default 27 °C is the upper edge of the Holiday Climate Index "ideal comfort" band (Scott, Rutty, Amelung & Tang, 2016). Above this, most warm-tourism travellers report measurable discomfort.
Greyed factors are scored normally — extreme heat overrides them, so a clear sky or low rain can't lift the period.
Greyed factors are scored normally — extreme heat overrides them, so a clear sky or low rain can't lift the period.
Greyed factors are scored normally — extreme heat overrides them, so a clear sky or low rain can't lift the period.
Greyed factors are scored normally — extreme heat overrides them, so a clear sky or low rain can't lift the period.
Greyed factors are scored normally — extreme heat overrides them, so a clear sky or low rain can't lift the period.
Greyed factors are scored normally — extreme heat overrides them, so a clear sky or low rain can't lift the period.
Greyed factors are scored normally — extreme heat overrides them, so a clear sky or low rain can't lift the period.
Greyed factors are scored normally — extreme heat overrides them, so a clear sky or low rain can't lift the period.
Greyed factors are scored normally — extreme heat overrides them, so a clear sky or low rain can't lift the period.
Greyed factors are scored normally — extreme heat overrides them, so a clear sky or low rain can't lift the period.
Greyed factors are scored normally — extreme heat overrides them, so a clear sky or low rain can't lift the period.
Greyed factors are scored normally — extreme heat overrides them, so a clear sky or low rain can't lift the period.
Greyed factors are scored normally — extreme heat overrides them, so a clear sky or low rain can't lift the period.
Greyed factors are scored normally — extreme heat overrides them, so a clear sky or low rain can't lift the period.
Greyed factors are scored normally — extreme heat overrides them, so a clear sky or low rain can't lift the period.
Greyed factors are scored normally — extreme heat overrides them, so a clear sky or low rain can't lift the period.
Greyed factors are scored normally — extreme heat overrides them, so a clear sky or low rain can't lift the period.
Greyed factors are scored normally — extreme heat overrides them, so a clear sky or low rain can't lift the period.
Greyed factors are scored normally — extreme heat overrides them, so a clear sky or low rain can't lift the period.
Greyed factors are scored normally — extreme heat overrides them, so a clear sky or low rain can't lift the period.
Greyed factors are scored normally — extreme heat overrides them, so a clear sky or low rain can't lift the period.
Greyed factors are scored normally — extreme heat overrides them, so a clear sky or low rain can't lift the period.
Greyed factors are scored normally — extreme heat overrides them, so a clear sky or low rain can't lift the period.
Greyed factors are scored normally — extreme heat overrides them, so a clear sky or low rain can't lift the period.
Greyed factors are scored normally — extreme heat overrides them, so a clear sky or low rain can't lift the period.
How is this scored? HCI / Steadman / CCI gate — full methodology and citations below.
Compare with another destination
Add as many as you like — stacked below the main strips above. Each row is just the recent-window score strip and (for beach destinations) sea-temperature strip.
Tours in Brisbane
15 top-rated tours via Viator. Booking links earn this site a commission at no cost to you. Map locations are approximate (centred on Brisbane).
- 1
 Brisbane Story Bridge Adventure Climb
 - 2
 Deluxe Wine Tour to Tamborine Mountain, includes two course lunch
 - 3
 Stradbroke Island Eco Day Trip from Brisbane – Wildlife & Beaches
 - 4
 Ultimate Brisbane Walking Tour (Small-Group, Drink Included)
 - 5
 Best of Brisbane Walking Tour: All Sights & Hidden Gems (Max 8)
 - 6
 Koalas, 6 Springbrook Waterfalls and Natural Bridge Day Tour
 - 7
 Full-Day Guided Wine Tour in Mt Tamborine From Gold Coast
 - 8
 Raby Bay Wildlife Kayak Tour
 - 9
 Brisbane Shore Excursion: Must-See City Tour with a Local
 - 10
 Trevena Glen Farm Animal Experience
 - 11
 Rock Climbing at the Kangaroo Point Cliffs in Brisbane
 - 12
 Private Group Tour Brisbane & Gold Coast Personal Tours
 - 13
 Brisbane Whale Watching Cruise from Redcliffe or Sunshine Coast
 - 14
 Brisbane Segway Sightseeing Tour
 - 15
 Private Car and Tour Guide for 2 Days Visit best of Cairo City
Last refreshed 2026-05-30.
Similar climatesIguazu Falls85% · Salta85% · Puerto Iguazú85%
Other destinations with the most-alike year-round climate to Brisbane (apparent temperature, rain hours, sunshine — matched within the same trip-profile). The ±N chip compares each match's typical score for the current month against Brisbane's. Based on the 2020-2024 climatology, not this year's actual weather.
Month-by-month
| Month | Temp °C | Feels °C | Rain days | Rain h | Rain h/day | Humidity | Wind km/h | Sun h | UV | Interest | Score |
|---|---|---|---|---|---|---|---|---|---|---|---|
| Jan | 21–29 | 31 | 19 | 228 | 12.0 | 64% | 17 | 256 | 10 | Quiet | 4 |
| Feb | 20–29 | 31 | 17 | 216 | 12.7 | 65% | 17 | 213 | 10 | Quiet | 4 |
| Mar | 19–28 | 30 | 16 | 210 | 13.1 | 66% | 16 | 224 | 8 | Quiet | 5 |
| Apr | 16–26 | 27 | 10 | 123 | 12.3 | 60% | 15 | 225 | 6 | Quiet | 8 |
| May | 13–23 | 22 | 9 | 122 | 13.6 | 62% | 15 | 204 | 4 | Quiet | 8 |
| Jun | 10–21 | 20 | 6 | 57 | 9.5 | 56% | 15 | 207 | 4 | Quiet | 9 |
| Jul | 10–20 | 19 | 7 | 96 | 13.7 | 58% | 16 | 198 | 4 | Quiet | 9 |
| Aug | 11–23 | 22 | 5 | 64 | 12.8 | 54% | 16 | 228 | 5 | Quiet | 10 |
| Sep | 13–25 | 24 | 8 | 76 | 9.5 | 52% | 17 | 237 | 7 | Quiet | 9 |
| Oct | 16–27 | 27 | 10 | 113 | 11.3 | 56% | 18 | 251 | 8 | Quiet | 9 |
| Nov | 18–27 | 28 | 13 | 161 | 12.4 | 58% | 18 | 245 | 9 | Peak | 7 |
| Dec | 20–29 | 31 | 14 | 176 | 12.6 | 61% | 17 | 263 | 11 | Busy | 5 |
UV Index in Brisbane by Month
UV index in Brisbane peaks at 11 (very high) in December, dropping to 4 (moderate) in June. January, February, October, November, December reach very high or extreme levels — apply SPF 50+, wear a hat and protective clothing, and limit direct sun between 11:00 and 17:00.
Best months in detail
August
10/1011–23°C · 5 rain days (64h) · 228 sun hours · 54% humidity · Quiet crowd · UV 5 (moderate) · sunniest 1 in 10 days reach 7 (high)
June
9/1010–21°C (feels 20°C) · 6 rain days (57h) · 207 sun hours · 56% humidity · Quiet crowd · UV 4 (moderate)
September
9/1013–25°C · 8 rain days (76h) · 237 sun hours · 52% humidity · Quiet crowd · UV 7 (high) · sunniest 1 in 10 days reach 8 (very high)
Every month
Show the other 9 months in detail
January
4/1021–29°C (feels 31°C) · 19 rain days (228h) · 256 sun hours · 64% humidity · Quiet crowd · UV 10 (very high) · sunniest 1 in 10 days reach 13 (extreme)
February
4/1020–29°C (feels 31°C) · 17 rain days (216h) · 213 sun hours · 65% humidity · Quiet crowd · UV 10 (very high) · sunniest 1 in 10 days reach 13 (extreme)
March
5/1019–28°C (feels 30°C) · 16 rain days (210h) · 224 sun hours · 66% humidity · Quiet crowd · UV 8 (high) · sunniest 1 in 10 days reach 10 (very high)
April
8/1016–26°C · 10 rain days (123h) · 225 sun hours · 60% humidity · Quiet crowd · UV 6 (high)
May
8/1013–23°C · 9 rain days (122h) · 204 sun hours · 62% humidity · Quiet crowd · UV 4 (moderate)
July
9/1010–20°C (feels 19°C) · 7 rain days (96h) · 198 sun hours · 58% humidity · Quiet crowd · UV 4 (moderate)
October
9/1016–27°C · 10 rain days (113h) · 251 sun hours · 56% humidity · Quiet crowd · UV 8 (very high) · sunniest 1 in 10 days reach 10 (very high)
November
7/1018–27°C · 13 rain days (161h) · 245 sun hours · 58% humidity · Peak crowd · UV 9 (very high) · sunniest 1 in 10 days reach 12 (extreme)
December
5/1020–29°C (feels 31°C) · 14 rain days (176h) · 263 sun hours · 61% humidity · Busy crowd · UV 11 (very high) · sunniest 1 in 10 days reach 13 (extreme)
Frequently asked questions about visiting Brisbane
When is the best time to visit Brisbane?
August is the highest-scoring month (10/10 on the Holiday Climate Index). Typical conditions: 11–23°C (5 rainy days). The top three months by score are August, June, September.
What is the worst time to visit Brisbane?
January is the lowest-scoring month (4/10, capped by extreme heat). Typical conditions: 21–29°C (19 rainy days).
Is Brisbane too hot in summer?
4 months (January, February, March, December) trip the heat deal-breaker in our scoring: apparent temperature crosses the comfort cap, so even with clear skies and low rain the score is held down. Plan around it if heat tolerance is low.
When are crowds lowest in Brisbane?
Search-interest seasonality (Google Trends 2021-2025) is lowest in May and peaks in November. Interest tracks both in-trip visitors and lead-time planners, so treat it as a "destination is on people's minds" signal rather than literal arrivals.
Which months in Brisbane have good weather but fewer tourists?
August (climate 10/10, crowd index 33) and June (climate 9/10, crowd index 25) — shoulder months with above-average climate and below-median search-interest. Often the best value-for-weather trade.
What is the UV index in Brisbane by month?
UV peaks at 11 (very high) in December and is lowest in June at 4 (moderate). Monthly peak values: Jan 10, Feb 10, Mar 8, Apr 6, May 4, Jun 4, Jul 4, Aug 5, Sep 7, Oct 8, Nov 9, Dec 11. January, February, October, November, December reach very high or extreme levels — apply SPF 50+, wear a hat and protective clothing, and limit direct sun between 11:00 and 17:00.
What is the UV index in Brisbane in December?
December is the peak UV month in Brisbane, with a daily-peak UV index of 11 (very high). At this level, sunburn can occur in under 20 minutes on unprotected fair skin. Apply SPF 50+, wear protective clothing and a hat, and avoid direct midday sun (11:00–17:00).
How high can UV get in Brisbane on the sunniest days?
Most days look like the monthly average, but on the sunniest ~1 in 10 days UV climbs higher than the mean suggests. January is the worst case: typical days average UV 10 (very high), but the top 10% of days reach UV 13 (extreme) — and even higher. Months where the sunniest days routinely exceed the typical reading: January, February, March, August, September, October, November, December. Plan sun protection for the worst case, not the average.