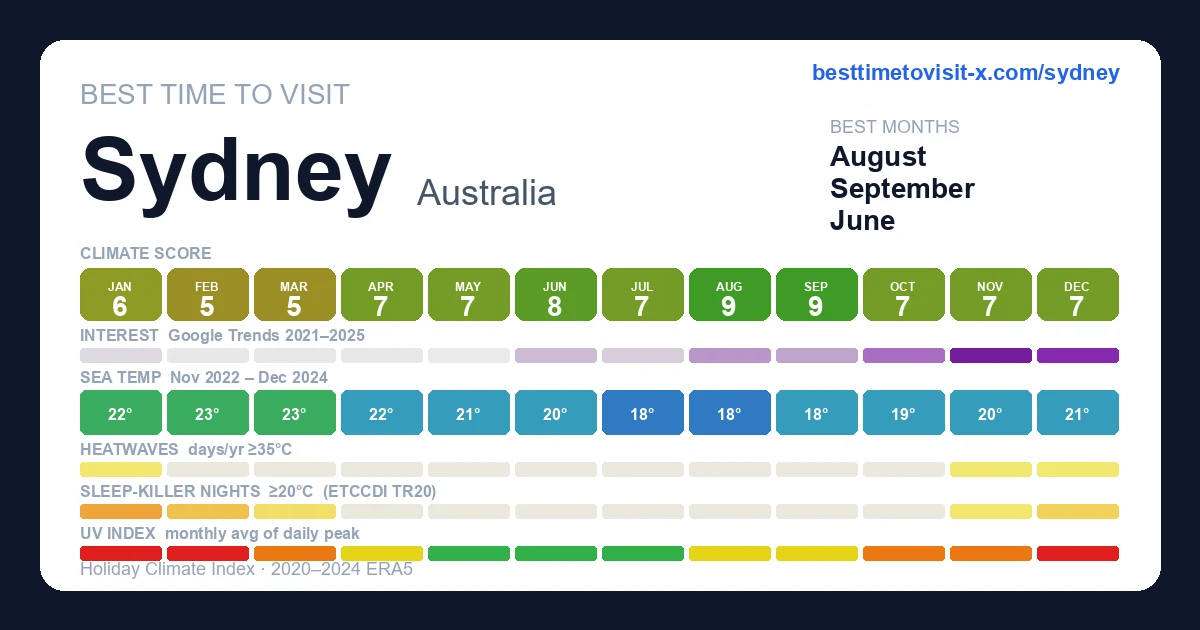
Best time to visit Sydney
Re-score for me — drag the dial — every chart recolours live for your heat & sea limits 27°C · sea 29°C
Default 27 °C is the upper edge of the Holiday Climate Index "ideal comfort" band (Scott, Rutty, Amelung & Tang, 2016). Above this, most warm-tourism travellers report measurable discomfort.
Default 29 °C is the Beach Climate Index "bathtub" line (Morgan et al.) — where the sea stops being refreshing and starts feeling like a warm bath.
How is this scored? HCI / Steadman / CCI gate — full methodology and citations below.
Compare with another destination
Add as many as you like — stacked below the main strips above. Each row is just the recent-window score strip and (for beach destinations) sea-temperature strip.
Tours in Sydney
22 top-rated tours via Viator. Booking links earn this site a commission at no cost to you.
- 1
 Whale Watching Boat Trip in Sydney
 - 2
 Blue Mountains Adventure w Scenic World, Zoo, Koala Photo & Ferry
 - 3
 Blue Mountain Small Group Tour All Inclusive* Multi Award Winner!
 - 4
 WILD Wombat and Kangaroo Day Tour, All Inclusive
 - 5
 Sydney Private Full-Day Tour: Opera House, Bondi Beach & Secrets
 - 6
 Sydney Whale-Watching Cruise Including Lunch or Breakfast
 - 7
 Intimate Blue Mountains Wild Kangaroos & Sunset for Nature Lovers
 - 8
 Sydney Opera House Backstage Guided Tour with Breakfast
 - 9
 Surfing Lessons on Sydney's Bondi Beach
 - 10
 Sunrise Paddle Session on Sydney Harbour (single kayak)
 - 11
 Sea Cliff Bridge, Kiama Blowhole, Beaches & Wildlife Small Group
 - 12
 Sydney City Highlights & Hidden Gems: Private or Small Group Tour
 - 13
 Sydney Uncovered Full-Day Private Tour
 - 14
 #1 Blue Mountains Small Group All Inclusive with Local Guide
 - 15
 Small Group: Blue Mountains with Zoo, Koala Photo & Scenic World
 - 16
 Blue Mountains Small Group Tour with Waterfall Walk & Fresh Lunch
 - 17
 Blue Mountains: Three Sisters, Scenic World and Wildlife park
 - 18
 Sydney The Rocks Guided Walking Tour
 - 19
 Chef-Led Hunter Valley Gourmet Food and Wine Day Tour from Sydney
 - 20
 Sydney Bike Tours
 - 21
 Behind The Scenes: Sydney Cricket Ground (SCG) Guided Walking Tour
 - 22
 Blue Mountains Deluxe Small Group Half or Full Day Discovery Tour
Last refreshed 2026-05-25.
Similar climatesGold Coast89% · Byron Bay87% · Tauranga84%
Other destinations with the most-alike year-round climate to Sydney (apparent temperature, rain hours, sunshine — matched within the same trip-profile). The ±N chip compares each match's typical score for the current month against Sydney's. Based on the 2020-2024 climatology, not this year's actual weather.
Month-by-month
| Month | Temp °C | Feels °C | Rain days | Rain h | Rain h/day | Humidity | Wind km/h | Sun h | UV | Interest | Score |
|---|---|---|---|---|---|---|---|---|---|---|---|
| Jan | 19–26 | 27 | 15 | 205 | 13.7 | 67% | 23 | 253 | 9 | Quiet | 6 |
| Feb | 19–26 | 26 | 16 | 215 | 13.4 | 68% | 23 | 211 | 8 | Quiet | 5 |
| Mar | 17–25 | 25 | 17 | 243 | 14.3 | 67% | 21 | 214 | 7 | Quiet | 5 |
| Apr | 14–22 | 22 | 11 | 147 | 13.4 | 65% | 18 | 206 | 5 | Quiet | 7 |
| May | 11–19 | 18 | 11 | 160 | 14.5 | 66% | 19 | 198 | 3 | Quiet | 7 |
| Jun | 8–17 | 15 | 9 | 107 | 11.9 | 65% | 19 | 187 | 2 | Quiet | 8 |
| Jul | 8–17 | 14 | 10 | 139 | 13.9 | 63% | 21 | 196 | 2 | Quiet | 7 |
| Aug | 9–19 | 17 | 7 | 92 | 13.1 | 58% | 20 | 210 | 3 | Moderate | 9 |
| Sep | 11–21 | 19 | 8 | 103 | 12.9 | 53% | 22 | 227 | 5 | Quiet | 9 |
| Oct | 13–22 | 21 | 12 | 145 | 12.1 | 58% | 23 | 235 | 6 | Moderate | 7 |
| Nov | 15–23 | 23 | 13 | 159 | 12.2 | 63% | 23 | 234 | 8 | Peak | 7 |
| Dec | 17–25 | 25 | 12 | 155 | 12.9 | 63% | 23 | 260 | 9 | Peak | 7 |
UV Index in Sydney by Month
UV index in Sydney peaks at 9 (very high) in December, dropping to 2 (low) in June. January, February, December reach very high or extreme levels — apply SPF 50+, wear a hat and protective clothing, and limit direct sun between 11:00 and 17:00.
Best months in detail
August
9/109–19°C (feels 17°C) · 7 rain days (92h) · 210 sun hours · 58% humidity · Moderate crowd · UV 3 (moderate)
September
9/1011–21°C (feels 19°C) · 8 rain days (103h) · 227 sun hours · 53% humidity · Quiet crowd · UV 5 (moderate) · sunniest 1 in 10 days reach 6 (high)
June
8/108–17°C (feels 15°C) · 9 rain days (107h) · 187 sun hours · 65% humidity · Quiet crowd · UV 2 (low)
Every month
Show the other 9 months in detail
January
6/1019–26°C · 15 rain days (205h) · 253 sun hours · 67% humidity · Quiet crowd · UV 9 (very high) · sunniest 1 in 10 days reach 12 (extreme)
February
5/1019–26°C · 16 rain days (215h) · 211 sun hours · 68% humidity · Quiet crowd · UV 8 (very high) · sunniest 1 in 10 days reach 11 (extreme)
March
5/1017–25°C · 17 rain days (243h) · 214 sun hours · 67% humidity · Quiet crowd · UV 7 (high) · sunniest 1 in 10 days reach 9 (very high)
April
7/1014–22°C · 11 rain days (147h) · 206 sun hours · 65% humidity · Quiet crowd · UV 5 (moderate) · sunniest 1 in 10 days reach 6 (high)
May
7/1011–19°C (feels 18°C) · 11 rain days (160h) · 198 sun hours · 66% humidity · Quiet crowd · UV 3 (low) · sunniest 1 in 10 days reach 4 (moderate)
July
7/108–17°C (feels 14°C) · 10 rain days (139h) · 196 sun hours · 63% humidity · Quiet crowd · UV 2 (low)
October
7/1013–22°C (feels 21°C) · 12 rain days (145h) · 235 sun hours · 58% humidity · Moderate crowd · UV 6 (high) · sunniest 1 in 10 days reach 9 (very high)
November
7/1015–23°C · 13 rain days (159h) · 234 sun hours · 63% humidity · Peak crowd · UV 8 (high) · sunniest 1 in 10 days reach 10 (very high)
December
7/1017–25°C · 12 rain days (155h) · 260 sun hours · 63% humidity · Peak crowd · UV 9 (very high) · sunniest 1 in 10 days reach 12 (extreme)
Comparisons people search for
Pairs validated by Google Autocomplete demand — only pairs people actually compare.
Frequently asked questions about visiting Sydney
When is the best time to visit Sydney?
August is the highest-scoring month (9/10 on the Holiday Climate Index). Typical conditions: 9–19°C (7 rainy days). The top three months by score are August, September, June.
What is the worst time to visit Sydney?
March is the lowest-scoring month (5/10). Typical conditions: 17–25°C (17 rainy days).
When are crowds lowest in Sydney?
Search-interest seasonality (Google Trends 2021-2025) is lowest in May and peaks in November. Interest tracks both in-trip visitors and lead-time planners, so treat it as a "destination is on people's minds" signal rather than literal arrivals.
Which months in Sydney have good weather but fewer tourists?
August (climate 9/10, crowd index 41) and September (climate 9/10, crowd index 35) — shoulder months with above-average climate and below-median search-interest. Often the best value-for-weather trade.
What is the UV index in Sydney by month?
UV peaks at 9 (very high) in December and is lowest in June at 2 (low). Monthly peak values: Jan 9, Feb 8, Mar 7, Apr 5, May 3, Jun 2, Jul 2, Aug 3, Sep 5, Oct 6, Nov 8, Dec 9. January, February, December reach very high or extreme levels — apply SPF 50+, wear a hat and protective clothing, and limit direct sun between 11:00 and 17:00.
What is the UV index in Sydney in December?
December is the peak UV month in Sydney, with a daily-peak UV index of 9 (very high). At this level, sunburn can occur in under 20 minutes on unprotected fair skin. Apply SPF 50+, wear protective clothing and a hat, and avoid direct midday sun (11:00–17:00).
How high can UV get in Sydney on the sunniest days?
Most days look like the monthly average, but on the sunniest ~1 in 10 days UV climbs higher than the mean suggests. January is the worst case: typical days average UV 9 (very high), but the top 10% of days reach UV 12 (extreme) — and even higher. Months where the sunniest days routinely exceed the typical reading: January, February, March, April, May, September, October, November, December. Plan sun protection for the worst case, not the average.
Is air quality in Sydney bad for travelers?
PM2.5 (fine-particle pollution) exceeds the WHO sensitive-group guideline (15 µg/m³) in 8 months: February, March, April, May, June, August, September, December. The worst month is June with a typical-day mean of 12 µg/m³ (moderate); on the worst 10% of days PM2.5 reaches 21 µg/m³ (unhealthy for sensitive) and higher. People with asthma, heart conditions, or sensitive children may want to avoid these months or limit outdoor activity. Source: CAMS via Open-Meteo.