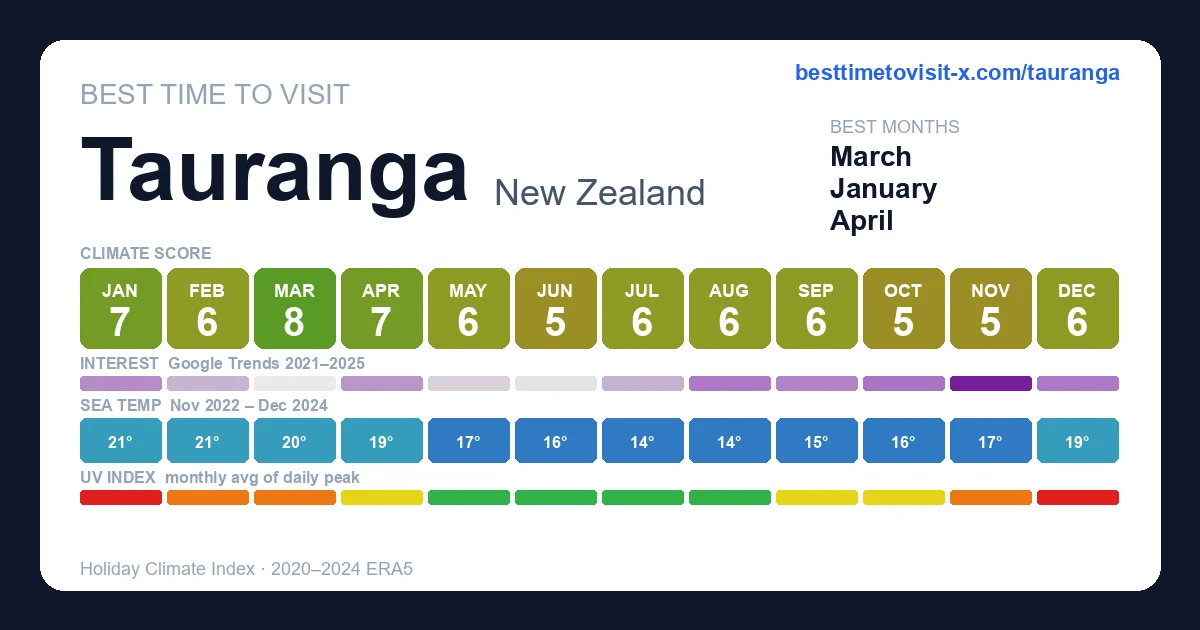
Best time to visit Tauranga
Re-score for me — drag the dial — every chart recolours live for your heat & sea limits 27°C · sea 29°C
Default 27 °C is the upper edge of the Holiday Climate Index "ideal comfort" band (Scott, Rutty, Amelung & Tang, 2016). Above this, most warm-tourism travellers report measurable discomfort.
Default 29 °C is the Beach Climate Index "bathtub" line (Morgan et al.) — where the sea stops being refreshing and starts feeling like a warm bath.
How is this scored? HCI / Steadman / CCI gate — full methodology and citations below.
Compare with another destination
Add as many as you like — stacked below the main strips above. Each row is just the recent-window score strip and (for beach destinations) sea-temperature strip.
Tours in Tauranga
8 top-rated tours via Viator. Booking links earn this site a commission at no cost to you. Map locations are approximate (centred on Tauranga).
- 1
 Rotorua Cultural and Geothermal Wonderland Tour – Depart Tauranga
 - 2
 Scenic Short Hike Tour - McLaren Falls and Puketoki Reserve
 - 3
 Hobbiton Movie Set Tour - Departs Tauranga
 - 4
 Tauranga City & History Scenic Tour – 2 Hours
 - 5
 Group Beginner Surf Lesson in Mount Maunganui
 - 6
 Katikati Gourmet Avocado Tasting
 - 7
 Tauranga Scenic Cruise Two Hours
 - 8
 White Water Rafting - Kaituna Cascades, The Originals
Last refreshed 2026-06-08.
Similar climatesPunta del Diablo84% · Sydney84% · José Ignacio83%
Other destinations with the most-alike year-round climate to Tauranga (apparent temperature, rain hours, sunshine — matched within the same trip-profile). The ±N chip compares each match's typical score for the current month against Tauranga's. Based on the 2020-2024 climatology, not this year's actual weather.
Month-by-month
| Month | Temp °C | Feels °C | Rain days | Rain h | Rain h/day | Humidity | Wind km/h | Sun h | UV | Interest | Score |
|---|---|---|---|---|---|---|---|---|---|---|---|
| Jan | 16–23 | 22 | 13 | 175 | 13.5 | 65% | 23 | 267 | 8 | Moderate | 7 |
| Feb | 16–23 | 22 | 13 | 191 | 14.7 | 68% | 22 | 226 | 8 | Quiet | 6 |
| Mar | 13–21 | 20 | 11 | 133 | 12.1 | 65% | 21 | 232 | 6 | Quiet | 8 |
| Apr | 12–19 | 18 | 11 | 158 | 14.4 | 71% | 21 | 197 | 4 | Moderate | 7 |
| May | 10–17 | 14 | 12 | 161 | 13.4 | 74% | 23 | 180 | 2 | Quiet | 6 |
| Jun | 9–15 | 12 | 13 | 192 | 14.8 | 78% | 23 | 156 | 2 | Quiet | 5 |
| Jul | 7–14 | 11 | 11 | 166 | 15.1 | 77% | 24 | 166 | 2 | Quiet | 6 |
| Aug | 7–14 | 12 | 11 | 149 | 13.5 | 73% | 21 | 193 | 2 | Moderate | 6 |
| Sep | 8–15 | 12 | 13 | 174 | 13.4 | 70% | 26 | 208 | 4 | Moderate | 6 |
| Oct | 10–17 | 15 | 14 | 201 | 14.4 | 71% | 24 | 220 | 5 | Moderate | 5 |
| Nov | 12–19 | 18 | 16 | 220 | 13.8 | 71% | 24 | 243 | 7 | Peak | 5 |
| Dec | 15–22 | 21 | 14 | 201 | 14.4 | 70% | 23 | 260 | 8 | Moderate | 6 |
UV Index in Tauranga by Month
UV index in Tauranga peaks at 8 (very high) in January, dropping to 2 (low) in June. January, December reach very high or extreme levels — apply SPF 50+, wear a hat and protective clothing, and limit direct sun between 11:00 and 17:00.
Best months in detail
March
8/1013–21°C (feels 20°C) · 11 rain days (133h) · 232 sun hours · 65% humidity · Quiet crowd · UV 6 (high) · sunniest 1 in 10 days reach 8 (very high)
April
7/1012–19°C (feels 18°C) · 11 rain days (158h) · 197 sun hours · 71% humidity · Moderate crowd · UV 4 (moderate)
January
7/1016–23°C · 13 rain days (175h) · 267 sun hours · 65% humidity · Moderate crowd · UV 8 (very high) · sunniest 1 in 10 days reach 11 (very high)
Every month
Show the other 9 months in detail
February
6/1016–23°C · 13 rain days (191h) · 226 sun hours · 68% humidity · Quiet crowd · UV 8 (high) · sunniest 1 in 10 days reach 10 (very high)
May
6/1010–17°C (feels 14°C) · 12 rain days (161h) · 180 sun hours · 74% humidity · Quiet crowd · UV 2 (low) · sunniest 1 in 10 days reach 3 (moderate)
June
5/109–15°C (feels 12°C) · 13 rain days (192h) · 156 sun hours · 78% humidity · Quiet crowd · UV 2 (low)
July
6/107–14°C (feels 11°C) · 11 rain days (166h) · 166 sun hours · 77% humidity · Quiet crowd · UV 2 (low)
August
6/107–14°C (feels 12°C) · 11 rain days (149h) · 193 sun hours · 73% humidity · Moderate crowd · UV 2 (low) · sunniest 1 in 10 days reach 3 (moderate)
September
6/108–15°C (feels 12°C) · 13 rain days (174h) · 208 sun hours · 70% humidity · Moderate crowd · UV 4 (moderate)
October
5/1010–17°C (feels 15°C) · 14 rain days (201h) · 220 sun hours · 71% humidity · Moderate crowd · UV 5 (moderate) · sunniest 1 in 10 days reach 7 (high)
November
5/1012–19°C (feels 18°C) · 16 rain days (220h) · 243 sun hours · 71% humidity · Peak crowd · UV 7 (high) · sunniest 1 in 10 days reach 9 (very high)
December
6/1015–22°C · 14 rain days (201h) · 260 sun hours · 70% humidity · Moderate crowd · UV 8 (very high) · sunniest 1 in 10 days reach 12 (extreme)
Frequently asked questions about visiting Tauranga
When is the best time to visit Tauranga?
March is the highest-scoring month (8/10 on the Holiday Climate Index). Typical conditions: 13–21°C (11 rainy days). The top three months by score are March, April, January.
What is the worst time to visit Tauranga?
November is the lowest-scoring month (5/10). Typical conditions: 12–19°C (16 rainy days).
When are crowds lowest in Tauranga?
Search-interest seasonality (Google Trends 2021-2025) is lowest in March and peaks in November. Interest tracks both in-trip visitors and lead-time planners, so treat it as a "destination is on people's minds" signal rather than literal arrivals.
Which months in Tauranga have good weather but fewer tourists?
March (climate 8/10, crowd index 0) and January (climate 7/10, crowd index 46) — shoulder months with above-average climate and below-median search-interest. Often the best value-for-weather trade.
What is the UV index in Tauranga by month?
UV peaks at 8 (very high) in January and is lowest in June at 2 (low). Monthly peak values: Jan 8, Feb 8, Mar 6, Apr 4, May 2, Jun 2, Jul 2, Aug 2, Sep 4, Oct 5, Nov 7, Dec 8. January, December reach very high or extreme levels — apply SPF 50+, wear a hat and protective clothing, and limit direct sun between 11:00 and 17:00.
What is the UV index in Tauranga in January?
January is the peak UV month in Tauranga, with a daily-peak UV index of 8 (very high). At this level, sunburn can occur in under 20 minutes on unprotected fair skin. Apply SPF 50+, wear protective clothing and a hat, and avoid direct midday sun (11:00–17:00).
How high can UV get in Tauranga on the sunniest days?
Most days look like the monthly average, but on the sunniest ~1 in 10 days UV climbs higher than the mean suggests. December is the worst case: typical days average UV 8 (very high), but the top 10% of days reach UV 12 (extreme) — and even higher. Months where the sunniest days routinely exceed the typical reading: January, February, March, May, August, October, November, December. Plan sun protection for the worst case, not the average.