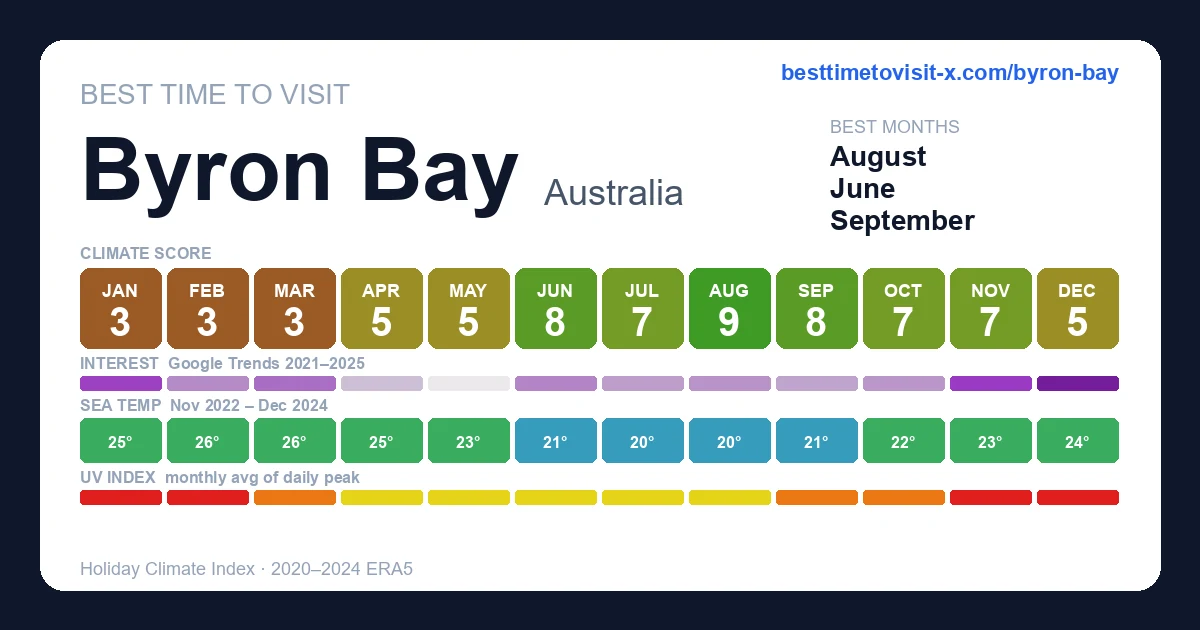
Best time to visit Byron Bay
Re-score for me — drag the dial — every chart recolours live for your heat & sea limits 27°C · sea 29°C
Default 27 °C is the upper edge of the Holiday Climate Index "ideal comfort" band (Scott, Rutty, Amelung & Tang, 2016). Above this, most warm-tourism travellers report measurable discomfort.
Default 29 °C is the Beach Climate Index "bathtub" line (Morgan et al.) — where the sea stops being refreshing and starts feeling like a warm bath.
Greyed factors are scored normally — extreme heat overrides them, so a clear sky or low rain can't lift the period.
How is this scored? HCI / Steadman / CCI gate — full methodology and citations below.
Compare with another destination
Add as many as you like — stacked below the main strips above. Each row is just the recent-window score strip and (for beach destinations) sea-temperature strip.
Tours in Byron Bay
12 top-rated tours via Viator. Booking links earn this site a commission at no cost to you. Map locations are approximate (centred on Byron Bay).
- 1
 2 Hour Private Surf Lesson in Byron Bay
 - 2
 Byron Bay: Tandem Skydive Experience
 - 3
 Premier Whale Watching Byron Bay
 - 4
 Byron Bay Wildlife Safari
 - 5
 Cape Byron Aboriginal Tour
 - 6
 Byron Bay Platypus Walk
 - 7
 Byron Bay - Three Day Surf & Stay
 - 8
 Broken Head Aboriginal Tour
 - 9
 Beyond Byron Hinterland Tour
 - 10
 Stand-Up Paddle Board Tour in Byron Bay
 - 11
 Sunset River Cruise near Byron Bay
 - 12
 Private Surf Lessons Kool Katz 1 Day
Last refreshed 2026-05-30.
Similar climatesGold Coast91% · Sydney87% · Townsville80%
Other destinations with the most-alike year-round climate to Byron Bay (apparent temperature, rain hours, sunshine — matched within the same trip-profile). The ±N chip compares each match's typical score for the current month against Byron Bay's. Based on the 2020-2024 climatology, not this year's actual weather.
Month-by-month
| Month | Temp °C | Feels °C | Rain days | Rain h | Rain h/day | Humidity | Wind km/h | Sun h | UV | Interest | Score |
|---|---|---|---|---|---|---|---|---|---|---|---|
| Jan | 22–27 | 29 | 20 | 279 | 13.9 | 72% | 20 | 259 | 10 | Busy | 3 |
| Feb | 21–27 | 29 | 18 | 283 | 15.7 | 73% | 20 | 209 | 10 | Moderate | 3 |
| Mar | 20–26 | 28 | 21 | 291 | 13.9 | 73% | 19 | 221 | 8 | Moderate | 3 |
| Apr | 17–24 | 25 | 16 | 237 | 14.8 | 70% | 19 | 221 | 6 | Quiet | 5 |
| May | 15–21 | 21 | 16 | 245 | 15.3 | 71% | 19 | 201 | 4 | Quiet | 5 |
| Jun | 12–20 | 18 | 8 | 99 | 12.4 | 65% | 18 | 203 | 3 | Moderate | 8 |
| Jul | 12–19 | 18 | 10 | 138 | 13.8 | 65% | 20 | 196 | 3 | Quiet | 7 |
| Aug | 13–21 | 20 | 9 | 97 | 10.8 | 63% | 19 | 225 | 5 | Moderate | 9 |
| Sep | 14–22 | 21 | 9 | 115 | 12.8 | 64% | 22 | 230 | 6 | Quiet | 8 |
| Oct | 17–24 | 23 | 13 | 159 | 12.2 | 66% | 23 | 254 | 8 | Moderate | 7 |
| Nov | 19–25 | 25 | 13 | 173 | 13.3 | 67% | 22 | 240 | 9 | Busy | 7 |
| Dec | 20–26 | 28 | 17 | 222 | 13.1 | 70% | 22 | 257 | 10 | Peak | 5 |
UV Index in Byron Bay by Month
UV index in Byron Bay peaks at 10 (very high) in January, dropping to 3 (moderate) in June. January, February, November, December reach very high or extreme levels — apply SPF 50+, wear a hat and protective clothing, and limit direct sun between 11:00 and 17:00.
Best months in detail
August
9/1013–21°C (feels 20°C) · 9 rain days (97h) · 225 sun hours · 63% humidity · Moderate crowd · UV 5 (moderate) · sunniest 1 in 10 days reach 6 (high)
June
8/1012–20°C (feels 18°C) · 8 rain days (99h) · 203 sun hours · 65% humidity · Moderate crowd · UV 3 (moderate)
September
8/1014–22°C (feels 21°C) · 9 rain days (115h) · 230 sun hours · 64% humidity · Quiet crowd · UV 6 (high)
Every month
Show the other 9 months in detail
January
3/1022–27°C (feels 29°C) · 20 rain days (279h) · 259 sun hours · 72% humidity · Busy crowd · UV 10 (very high) · sunniest 1 in 10 days reach 13 (extreme)
February
3/1021–27°C (feels 29°C) · 18 rain days (283h) · 209 sun hours · 73% humidity · Moderate crowd · UV 10 (very high) · sunniest 1 in 10 days reach 13 (extreme)
March
3/1020–26°C (feels 28°C) · 21 rain days (291h) · 221 sun hours · 73% humidity · Moderate crowd · UV 8 (high) · sunniest 1 in 10 days reach 10 (very high)
April
5/1017–24°C · 16 rain days (237h) · 221 sun hours · 70% humidity · Quiet crowd · UV 6 (moderate) · sunniest 1 in 10 days reach 8 (high)
May
5/1015–21°C · 16 rain days (245h) · 201 sun hours · 71% humidity · Quiet crowd · UV 4 (moderate)
July
7/1012–19°C (feels 18°C) · 10 rain days (138h) · 196 sun hours · 65% humidity · Quiet crowd · UV 3 (moderate)
October
7/1017–24°C · 13 rain days (159h) · 254 sun hours · 66% humidity · Moderate crowd · UV 8 (high) · sunniest 1 in 10 days reach 10 (very high)
November
7/1019–25°C · 13 rain days (173h) · 240 sun hours · 67% humidity · Busy crowd · UV 9 (very high) · sunniest 1 in 10 days reach 12 (extreme)
December
5/1020–26°C (feels 28°C) · 17 rain days (222h) · 257 sun hours · 70% humidity · Peak crowd · UV 10 (very high) · sunniest 1 in 10 days reach 13 (extreme)
Frequently asked questions about visiting Byron Bay
When is the best time to visit Byron Bay?
August is the highest-scoring month (9/10 on the Holiday Climate Index). Typical conditions: 13–21°C (9 rainy days). The top three months by score are August, June, September.
What is the worst time to visit Byron Bay?
March is the lowest-scoring month (3/10). Typical conditions: 20–26°C (21 rainy days).
When are crowds lowest in Byron Bay?
Search-interest seasonality (Google Trends 2021-2025) is lowest in May and peaks in December. Interest tracks both in-trip visitors and lead-time planners, so treat it as a "destination is on people's minds" signal rather than literal arrivals.
Which months in Byron Bay have good weather but fewer tourists?
August (climate 9/10, crowd index 42) and June (climate 8/10, crowd index 48) — shoulder months with above-average climate and below-median search-interest. Often the best value-for-weather trade.
What is the UV index in Byron Bay by month?
UV peaks at 10 (very high) in January and is lowest in June at 3 (moderate). Monthly peak values: Jan 10, Feb 10, Mar 8, Apr 6, May 4, Jun 3, Jul 3, Aug 5, Sep 6, Oct 8, Nov 9, Dec 10. January, February, November, December reach very high or extreme levels — apply SPF 50+, wear a hat and protective clothing, and limit direct sun between 11:00 and 17:00.
What is the UV index in Byron Bay in January?
January is the peak UV month in Byron Bay, with a daily-peak UV index of 10 (very high). At this level, sunburn can occur in under 20 minutes on unprotected fair skin. Apply SPF 50+, wear protective clothing and a hat, and avoid direct midday sun (11:00–17:00).
How high can UV get in Byron Bay on the sunniest days?
Most days look like the monthly average, but on the sunniest ~1 in 10 days UV climbs higher than the mean suggests. January is the worst case: typical days average UV 10 (very high), but the top 10% of days reach UV 13 (extreme) — and even higher. Months where the sunniest days routinely exceed the typical reading: January, February, March, April, August, October, November, December. Plan sun protection for the worst case, not the average.