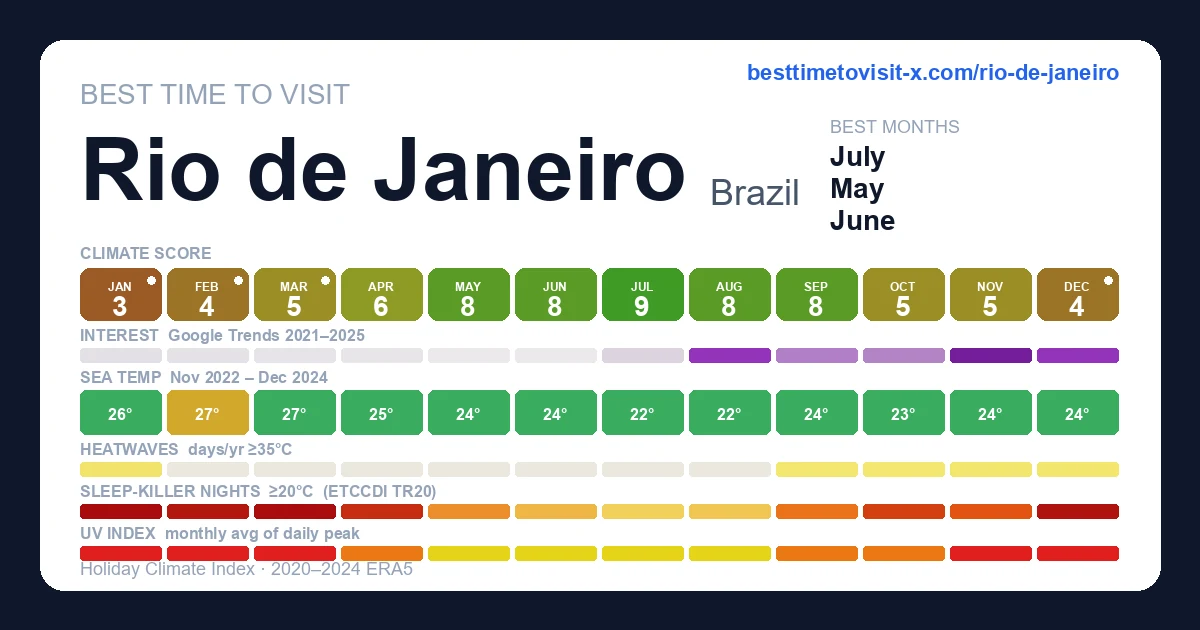
Best time to visit Rio de Janeiro
Re-score for me — drag the dial — every chart recolours live for your heat & sea limits 27°C · sea 29°C
Default 27 °C is the upper edge of the Holiday Climate Index "ideal comfort" band (Scott, Rutty, Amelung & Tang, 2016). Above this, most warm-tourism travellers report measurable discomfort.
Default 29 °C is the Beach Climate Index "bathtub" line (Morgan et al.) — where the sea stops being refreshing and starts feeling like a warm bath.
Greyed factors are scored normally — extreme heat overrides them, so a clear sky or low rain can't lift the period.
Greyed factors are scored normally — extreme heat overrides them, so a clear sky or low rain can't lift the period.
Greyed factors are scored normally — extreme heat overrides them, so a clear sky or low rain can't lift the period.
Greyed factors are scored normally — extreme heat overrides them, so a clear sky or low rain can't lift the period.
Greyed factors are scored normally — extreme heat overrides them, so a clear sky or low rain can't lift the period.
Greyed factors are scored normally — extreme heat overrides them, so a clear sky or low rain can't lift the period.
Greyed factors are scored normally — extreme heat overrides them, so a clear sky or low rain can't lift the period.
Greyed factors are scored normally — extreme heat overrides them, so a clear sky or low rain can't lift the period.
Greyed factors are scored normally — extreme heat overrides them, so a clear sky or low rain can't lift the period.
Greyed factors are scored normally — extreme heat overrides them, so a clear sky or low rain can't lift the period.
Greyed factors are scored normally — extreme heat overrides them, so a clear sky or low rain can't lift the period.
Greyed factors are scored normally — extreme heat overrides them, so a clear sky or low rain can't lift the period.
Greyed factors are scored normally — extreme heat overrides them, so a clear sky or low rain can't lift the period.
Greyed factors are scored normally — extreme heat overrides them, so a clear sky or low rain can't lift the period.
Greyed factors are scored normally — extreme heat overrides them, so a clear sky or low rain can't lift the period.
Greyed factors are scored normally — extreme heat overrides them, so a clear sky or low rain can't lift the period.
Greyed factors are scored normally — extreme heat overrides them, so a clear sky or low rain can't lift the period.
Greyed factors are scored normally — extreme heat overrides them, so a clear sky or low rain can't lift the period.
Greyed factors are scored normally — extreme heat overrides them, so a clear sky or low rain can't lift the period.
Greyed factors are scored normally — extreme heat overrides them, so a clear sky or low rain can't lift the period.
Greyed factors are scored normally — extreme heat overrides them, so a clear sky or low rain can't lift the period.
Greyed factors are scored normally — extreme heat overrides them, so a clear sky or low rain can't lift the period.
Greyed factors are scored normally — extreme heat overrides them, so a clear sky or low rain can't lift the period.
Greyed factors are scored normally — extreme heat overrides them, so a clear sky or low rain can't lift the period.
Greyed factors are scored normally — extreme heat overrides them, so a clear sky or low rain can't lift the period.
Greyed factors are scored normally — extreme heat overrides them, so a clear sky or low rain can't lift the period.
Greyed factors are scored normally — extreme heat overrides them, so a clear sky or low rain can't lift the period.
Greyed factors are scored normally — extreme heat overrides them, so a clear sky or low rain can't lift the period.
Greyed factors are scored normally — extreme heat overrides them, so a clear sky or low rain can't lift the period.
Greyed factors are scored normally — extreme heat overrides them, so a clear sky or low rain can't lift the period.
Greyed factors are scored normally — extreme heat overrides them, so a clear sky or low rain can't lift the period.
Greyed factors are scored normally — extreme heat overrides them, so a clear sky or low rain can't lift the period.
Greyed factors are scored normally — extreme heat overrides them, so a clear sky or low rain can't lift the period.
Greyed factors are scored normally — extreme heat overrides them, so a clear sky or low rain can't lift the period.
Greyed factors are scored normally — extreme heat overrides them, so a clear sky or low rain can't lift the period.
Greyed factors are scored normally — extreme heat overrides them, so a clear sky or low rain can't lift the period.
Greyed factors are scored normally — extreme heat overrides them, so a clear sky or low rain can't lift the period.
Greyed factors are scored normally — extreme heat overrides them, so a clear sky or low rain can't lift the period.
Greyed factors are scored normally — extreme heat overrides them, so a clear sky or low rain can't lift the period.
Greyed factors are scored normally — extreme heat overrides them, so a clear sky or low rain can't lift the period.
Greyed factors are scored normally — extreme heat overrides them, so a clear sky or low rain can't lift the period.
Greyed factors are scored normally — extreme heat overrides them, so a clear sky or low rain can't lift the period.
Greyed factors are scored normally — extreme heat overrides them, so a clear sky or low rain can't lift the period.
Greyed factors are scored normally — extreme heat overrides them, so a clear sky or low rain can't lift the period.
Greyed factors are scored normally — extreme heat overrides them, so a clear sky or low rain can't lift the period.
How is this scored? HCI / Steadman / CCI gate — full methodology and citations below.
Compare with another destination
Add as many as you like — stacked below the main strips above. Each row is just the recent-window score strip and (for beach destinations) sea-temperature strip.
Tours in Rio de Janeiro
16 top-rated tours via Viator. Booking links earn this site a commission at no cost to you. Map locations are approximate (centred on Rio de Janeiro).
- 1
 The Best Half Day in Rio with Christ Redeemer and Sugar Loaf Hill
 - 2
 Hang gliding Hang gliding Experience Rotorfly
 - 3
 Swim Under Tijuca Waterfalls — Hike, Caves, Wildlife & Rio Views
 - 4
 Explore the Best of Tijuca Forest – Hike to Peaks, Caves & Falls
 - 5
 Rio Maracana Stadium Football Match Ticket & Private Transport
 - 6
 Private Custom Full-Day Highlights in Rio: Only the Best Sights!
 - 7
 Rio: Copacabana Food Tour with 7 Tastings and Local Flavors
 - 8
 Rio's Full Day: Selarón Steps, Christ & Sugarloaf – Tickets & Lunch Included
 - 9
 Rio de Janeiro Sunset Sailing Tour with Drinks
 - 10
 Rio de Janeiro Helicopter Tour – Scenic Flights Over Landmarks
 - 11
 Best of Rio in One Day: Christ Redeemer, Sugarloaf & Local Lunch
 - 12
 Rio de Janeiro Helicopter Tour - Christ the Redeemer
 - 13
 Rio's Cookin' Good: 9-Dish & Caipis Fiesta + Optional Market Tour
 - 14
 Rio’s Best_Corcovado, Sugar Loaf, Selaron, Cathedral and more
 - 15
 Rio de Janeiro: Helicopter Tour Without Doors at Christ the Redeemer
 - 16
 Food Tour Rio de Janeiro - The Best Typical Brazilian Dishes
Last refreshed 2026-05-25.
Similar climatesGold Coast84% · Townsville83% · Sydney79%
Other destinations with the most-alike year-round climate to Rio de Janeiro (apparent temperature, rain hours, sunshine — matched within the same trip-profile). The ±N chip compares each match's typical score for the current month against Rio de Janeiro's. Based on the 2020-2024 climatology, not this year's actual weather.
Month-by-month
| Month | Temp °C | Feels °C | Rain days | Rain h | Rain h/day | Humidity | Wind km/h | Sun h | UV | Interest | Score |
|---|---|---|---|---|---|---|---|---|---|---|---|
| Jan | 24–29 | 33 | 16 | 204 | 12.8 | 74% | 16 | 237 | 10 | Quiet | 3 |
| Feb | 24–29 | 33 | 16 | 172 | 10.8 | 75% | 15 | 212 | 11 | Quiet | 4 |
| Mar | 23–29 | 33 | 10 | 144 | 14.4 | 73% | 16 | 249 | 9 | Quiet | 5 |
| Apr | 21–27 | 29 | 13 | 165 | 12.7 | 72% | 17 | 226 | 7 | Quiet | 6 |
| May | 20–26 | 28 | 8 | 116 | 14.5 | 70% | 16 | 222 | 5 | Quiet | 8 |
| Jun | 19–25 | 27 | 9 | 115 | 12.8 | 68% | 15 | 207 | 5 | Quiet | 8 |
| Jul | 18–25 | 26 | 7 | 90 | 12.9 | 67% | 16 | 212 | 4 | Quiet | 9 |
| Aug | 18–25 | 26 | 9 | 129 | 14.3 | 68% | 18 | 215 | 6 | Busy | 8 |
| Sep | 20–27 | 29 | 8 | 111 | 13.9 | 70% | 19 | 224 | 7 | Moderate | 8 |
| Oct | 21–26 | 29 | 16 | 189 | 11.8 | 76% | 19 | 213 | 8 | Moderate | 5 |
| Nov | 21–27 | 29 | 15 | 190 | 12.7 | 74% | 18 | 227 | 9 | Peak | 5 |
| Dec | 22–28 | 32 | 17 | 216 | 12.7 | 75% | 17 | 239 | 10 | Busy | 4 |
UV Index in Rio de Janeiro by Month
UV index in Rio de Janeiro peaks at 11 (very high) in February, dropping to 4 (moderate) in July. January, February, March, November, December reach very high or extreme levels — apply SPF 50+, wear a hat and protective clothing, and limit direct sun between 11:00 and 17:00.
Best months in detail
July
9/1018–25°C (feels 26°C) · 7 rain days (90h) · 212 sun hours · 67% humidity · Quiet crowd · UV 4 (moderate)
June
8/1019–25°C (feels 27°C) · 9 rain days (115h) · 207 sun hours · 68% humidity · Quiet crowd · UV 5 (moderate)
May
8/1020–26°C (feels 28°C) · 8 rain days (116h) · 222 sun hours · 70% humidity · Quiet crowd · UV 5 (moderate) · sunniest 1 in 10 days reach 7 (high)
Every month
Show the other 9 months in detail
January
3/1024–29°C (feels 33°C) · 16 rain days (204h) · 237 sun hours · 74% humidity · Quiet crowd · UV 10 (very high) · sunniest 1 in 10 days reach 13 (extreme)
February
4/1024–29°C (feels 33°C) · 16 rain days (172h) · 212 sun hours · 75% humidity · Quiet crowd · UV 11 (very high) · sunniest 1 in 10 days reach 13 (extreme)
March
5/1023–29°C (feels 33°C) · 10 rain days (144h) · 249 sun hours · 73% humidity · Quiet crowd · UV 9 (very high) · sunniest 1 in 10 days reach 11 (very high)
April
6/1021–27°C (feels 29°C) · 13 rain days (165h) · 226 sun hours · 72% humidity · Quiet crowd · UV 7 (high) · sunniest 1 in 10 days reach 9 (very high)
August
8/1018–25°C (feels 26°C) · 9 rain days (129h) · 215 sun hours · 68% humidity · Busy crowd · UV 6 (moderate) · sunniest 1 in 10 days reach 8 (high)
September
8/1020–27°C (feels 29°C) · 8 rain days (111h) · 224 sun hours · 70% humidity · Moderate crowd · UV 7 (high) · sunniest 1 in 10 days reach 9 (very high)
October
5/1021–26°C (feels 29°C) · 16 rain days (189h) · 213 sun hours · 76% humidity · Moderate crowd · UV 8 (high) · sunniest 1 in 10 days reach 11 (extreme)
November
5/1021–27°C (feels 29°C) · 15 rain days (190h) · 227 sun hours · 74% humidity · Peak crowd · UV 9 (very high) · sunniest 1 in 10 days reach 12 (extreme)
December
4/1022–28°C (feels 32°C) · 17 rain days (216h) · 239 sun hours · 75% humidity · Busy crowd · UV 10 (very high) · sunniest 1 in 10 days reach 13 (extreme)
Comparisons people search for
Pairs validated by Google Autocomplete demand — only pairs people actually compare.
- Rio de Janeiro vs Cape Town
- Rio de Janeiro vs Bangkok
- Rio de Janeiro vs Paris
- Rio de Janeiro vs Buenos Aires
- Rio de Janeiro vs Honolulu
- Rio de Janeiro vs Lisbon
- Rio de Janeiro vs New York City
- Rio de Janeiro vs Chicago
- Rio de Janeiro vs London
- Rio de Janeiro vs Barcelona
- Rio de Janeiro vs San Francisco
- Rio de Janeiro vs Dubai
Frequently asked questions about visiting Rio de Janeiro
When is the best time to visit Rio de Janeiro?
July is the highest-scoring month (9/10 on the Holiday Climate Index). Typical conditions: 18–25°C (7 rainy days). The top three months by score are July, June, May.
What is the worst time to visit Rio de Janeiro?
January is the lowest-scoring month (3/10, capped by extreme heat). Typical conditions: 24–29°C (16 rainy days).
Is Rio de Janeiro too hot in summer?
4 months (January, February, March, December) trip the heat deal-breaker in our scoring: apparent temperature crosses the comfort cap, so even with clear skies and low rain the score is held down. Plan around it if heat tolerance is low.
When are crowds lowest in Rio de Janeiro?
Search-interest seasonality (Google Trends 2021-2025) is lowest in May and peaks in November. Interest tracks both in-trip visitors and lead-time planners, so treat it as a "destination is on people's minds" signal rather than literal arrivals.
Which months in Rio de Janeiro have good weather but fewer tourists?
July (climate 9/10, crowd index 12) and May (climate 8/10, crowd index 0) — shoulder months with above-average climate and below-median search-interest. Often the best value-for-weather trade.
What is the UV index in Rio de Janeiro by month?
UV peaks at 11 (very high) in February and is lowest in July at 4 (moderate). Monthly peak values: Jan 10, Feb 11, Mar 9, Apr 7, May 5, Jun 5, Jul 4, Aug 6, Sep 7, Oct 8, Nov 9, Dec 10. January, February, March, November, December reach very high or extreme levels — apply SPF 50+, wear a hat and protective clothing, and limit direct sun between 11:00 and 17:00.
What is the UV index in Rio de Janeiro in February?
February is the peak UV month in Rio de Janeiro, with a daily-peak UV index of 11 (very high). At this level, sunburn can occur in under 20 minutes on unprotected fair skin. Apply SPF 50+, wear protective clothing and a hat, and avoid direct midday sun (11:00–17:00).
How high can UV get in Rio de Janeiro on the sunniest days?
Most days look like the monthly average, but on the sunniest ~1 in 10 days UV climbs higher than the mean suggests. January is the worst case: typical days average UV 10 (very high), but the top 10% of days reach UV 13 (extreme) — and even higher. Months where the sunniest days routinely exceed the typical reading: January, February, March, April, May, August, September, October, November, December. Plan sun protection for the worst case, not the average.
Is air quality in Rio de Janeiro bad for travelers?
PM2.5 (fine-particle pollution) exceeds the WHO sensitive-group guideline (15 µg/m³) in 12 months: January, February, March, April, May, June, July, August, September, October, November, December. The worst month is June with a typical-day mean of 24 µg/m³ (unhealthy for sensitive); on the worst 10% of days PM2.5 reaches 43 µg/m³ (hazardous) and higher. People with asthma, heart conditions, or sensitive children may want to avoid these months or limit outdoor activity. Source: CAMS via Open-Meteo.