Best time to visit Athabasca Glacier
Re-score for me — drag the dial — every chart on the page recolours live for your heat limit 27°C
Default 27 °C is the upper edge of the Holiday Climate Index "ideal comfort" band (Scott, Rutty, Amelung & Tang, 2016). Above this, most warm-tourism travellers report measurable discomfort.
Greyed factors are scored normally — extreme cold overrides them, so a clear sky or low rain can't lift the period.
Greyed factors are scored normally — extreme cold overrides them, so a clear sky or low rain can't lift the period.
Greyed factors are scored normally — extreme cold overrides them, so a clear sky or low rain can't lift the period.
Greyed factors are scored normally — extreme cold overrides them, so a clear sky or low rain can't lift the period.
Greyed factors are scored normally — extreme cold overrides them, so a clear sky or low rain can't lift the period.
Greyed factors are scored normally — extreme cold overrides them, so a clear sky or low rain can't lift the period.
Greyed factors are scored normally — extreme cold overrides them, so a clear sky or low rain can't lift the period.
Greyed factors are scored normally — extreme cold overrides them, so a clear sky or low rain can't lift the period.
Greyed factors are scored normally — extreme cold overrides them, so a clear sky or low rain can't lift the period.
Greyed factors are scored normally — extreme cold overrides them, so a clear sky or low rain can't lift the period.
Greyed factors are scored normally — extreme cold overrides them, so a clear sky or low rain can't lift the period.
Greyed factors are scored normally — extreme cold overrides them, so a clear sky or low rain can't lift the period.
Greyed factors are scored normally — extreme cold overrides them, so a clear sky or low rain can't lift the period.
Greyed factors are scored normally — extreme cold overrides them, so a clear sky or low rain can't lift the period.
Greyed factors are scored normally — extreme cold overrides them, so a clear sky or low rain can't lift the period.
Greyed factors are scored normally — extreme cold overrides them, so a clear sky or low rain can't lift the period.
Greyed factors are scored normally — extreme cold overrides them, so a clear sky or low rain can't lift the period.
Greyed factors are scored normally — extreme cold overrides them, so a clear sky or low rain can't lift the period.
Greyed factors are scored normally — extreme cold overrides them, so a clear sky or low rain can't lift the period.
Greyed factors are scored normally — extreme cold overrides them, so a clear sky or low rain can't lift the period.
Greyed factors are scored normally — extreme cold overrides them, so a clear sky or low rain can't lift the period.
Greyed factors are scored normally — extreme cold overrides them, so a clear sky or low rain can't lift the period.
Greyed factors are scored normally — extreme cold overrides them, so a clear sky or low rain can't lift the period.
Greyed factors are scored normally — extreme cold overrides them, so a clear sky or low rain can't lift the period.
Greyed factors are scored normally — extreme cold overrides them, so a clear sky or low rain can't lift the period.
Greyed factors are scored normally — extreme cold overrides them, so a clear sky or low rain can't lift the period.
Greyed factors are scored normally — extreme cold overrides them, so a clear sky or low rain can't lift the period.
Greyed factors are scored normally — extreme cold overrides them, so a clear sky or low rain can't lift the period.
Greyed factors are scored normally — extreme cold overrides them, so a clear sky or low rain can't lift the period.
Greyed factors are scored normally — extreme cold overrides them, so a clear sky or low rain can't lift the period.
Greyed factors are scored normally — extreme cold overrides them, so a clear sky or low rain can't lift the period.
Greyed factors are scored normally — extreme cold overrides them, so a clear sky or low rain can't lift the period.
Greyed factors are scored normally — extreme cold overrides them, so a clear sky or low rain can't lift the period.
Greyed factors are scored normally — extreme cold overrides them, so a clear sky or low rain can't lift the period.
Greyed factors are scored normally — extreme cold overrides them, so a clear sky or low rain can't lift the period.
Greyed factors are scored normally — extreme cold overrides them, so a clear sky or low rain can't lift the period.
Greyed factors are scored normally — extreme cold overrides them, so a clear sky or low rain can't lift the period.
Greyed factors are scored normally — extreme cold overrides them, so a clear sky or low rain can't lift the period.
Greyed factors are scored normally — extreme cold overrides them, so a clear sky or low rain can't lift the period.
Greyed factors are scored normally — extreme cold overrides them, so a clear sky or low rain can't lift the period.
Greyed factors are scored normally — extreme cold overrides them, so a clear sky or low rain can't lift the period.
Greyed factors are scored normally — extreme cold overrides them, so a clear sky or low rain can't lift the period.
Greyed factors are scored normally — extreme cold overrides them, so a clear sky or low rain can't lift the period.
Greyed factors are scored normally — extreme cold overrides them, so a clear sky or low rain can't lift the period.
Greyed factors are scored normally — extreme cold overrides them, so a clear sky or low rain can't lift the period.
Greyed factors are scored normally — extreme cold overrides them, so a clear sky or low rain can't lift the period.
Greyed factors are scored normally — extreme cold overrides them, so a clear sky or low rain can't lift the period.
Greyed factors are scored normally — extreme cold overrides them, so a clear sky or low rain can't lift the period.
Greyed factors are scored normally — extreme cold overrides them, so a clear sky or low rain can't lift the period.
Greyed factors are scored normally — extreme cold overrides them, so a clear sky or low rain can't lift the period.
Greyed factors are scored normally — extreme cold overrides them, so a clear sky or low rain can't lift the period.
How is this scored? HCI / Steadman / CCI gate — full methodology and citations below.
Compare with another destination
Add as many as you like — stacked below the main strips above. Each row is just the recent-window score strip and (for beach destinations) sea-temperature strip.
Tours in Athabasca Glacier
23 top-rated tours via Viator. Booking links earn this site a commission at no cost to you. Map locations are approximate (centred on Athabasca Glacier).
- 1
 Guided Glacier Hike on The Athabasca with IceWalks
 - 2
 Athabasca Falls/Abraham icebubble,Sunwpata Falls,Icefield & Peyto
 - 3
 Tread Lightly Glacier Hikes
 - 4
 Canadian Rocky Mountains & Banff 5-Day Premium Tour
 - 5
 Jasper to Banff One-Way Tour
 - 6
 Ice Odyssey at Columbia Icefield
 - 7
 Self-Guided Audio Driving Tour in Icefields Parkway
 - 8
 Canadian Rockies and Banff 4-Day Tour from Vancouver (Chn&Eng)
 - 9
 Full Day Guided Glacier Hike on The Athabasca with IceWalks
 - 10
 Jasper and Columbia Skywalk Icefield Parkway Private Day Tour
 - 11
 Icefields Parkway: a Smartphone Audio Driving Tour
 - 12Self-Guided Audio Tours for the Canadian Rockies
- 13
 Icefields Parkway Experience
 - 14
 Athabasca Glacier and Skywalk Small Group Tour with Lunch
 - 15
 Rocky Mountain Adventure
 - 16
 Columbia Icefield - Canadian Rockies - Premium Day Guided Tour
 - 17
 Calgary: Columbia Icefield, Skywalk, Crowfoot Glacier and Lakes
 - 18
 Banff to Jasper Columbia Icefield Glacier Walk Private VIP Tour
 - 19
 Banff & Jasper: Ultimate Canadian Rockies Experience
 - 20
 Banff Private Tour: Moraine, Louise, Peyto & Icefields Parkway
 - 21
 6 Day Canadian Rocky Mountains Explorer Private Tour
 - 22
 16 Days Premium Tour in Western Canada and Vancouver Island
 - 23
 Vancouver to Jasper AI Audio Guide Tour
Last refreshed 2026-08-13.
Similar climatesGlacier National Park85% · Maligne Lake82% · Moraine Lake81%
Other destinations with the most-alike year-round climate to Athabasca Glacier (apparent temperature, rain hours, sunshine — matched within the same trip-profile). The ±N chip compares each match's typical score for the current month against Athabasca Glacier's. Based on the 2020-2024 climatology, not this year's actual weather.
Month-by-month
| Month | Temp °C | Feels °C | Rain days | Rain h | Rain h/day | Humidity | Wind km/h | Sun h | UV | Interest | Score |
|---|---|---|---|---|---|---|---|---|---|---|---|
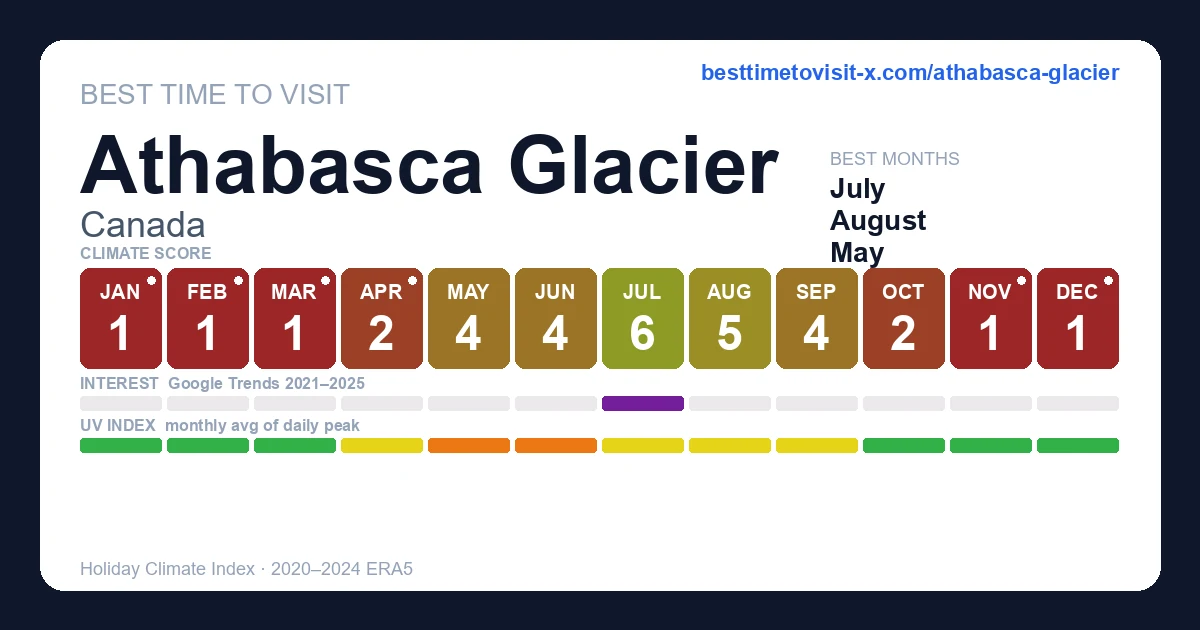
| Jan | -17–-12 | -16 | 18 | 307 | 17.1 | 86% | 8 | 77 | 1 | Quiet | 1 |
| Feb | -18–-13 | -17 | 18 | 303 | 16.8 | 83% | 8 | 109 | 1 | Quiet | 1 |
| Mar | -15–-9 | -13 | 15 | 247 | 16.5 | 79% | 7 | 185 | 3 | Quiet | 1 |
| Apr | -11–-6 | -10 | 13 | 214 | 16.5 | 76% | 8 | 226 | 5 | Quiet | 2 |
| May | -4–2 | -1 | 12 | 185 | 15.4 | 76% | 7 | 262 | 7 | Quiet | 4 |
| Jun | 1–6 | 4 | 13 | 172 | 13.2 | 77% | 8 | 271 | 6 | Busy | 4 |
| Jul | 6–13 | 11 | 14 | 155 | 11.1 | 61% | 12 | 318 | 6 | Peak | 6 |
| Aug | 5–12 | 10 | 14 | 162 | 11.6 | 65% | 12 | 263 | 5 | Peak | 5 |
| Sep | 0–7 | 4 | 12 | 153 | 12.8 | 74% | 11 | 216 | 4 | Moderate | 4 |
| Oct | -8–-2 | -5 | 15 | 250 | 16.7 | 84% | 9 | 136 | 2 | Quiet | 2 |
| Nov | -14–-9 | -13 | 17 | 290 | 17.1 | 86% | 9 | 77 | 1 | Quiet | 1 |
| Dec | -17–-12 | -16 | 15 | 282 | 18.8 | 85% | 8 | 69 | 1 | Quiet | 1 |
UV Index in Athabasca Glacier by Month
UV index in Athabasca Glacier peaks at 7 (high) in May, dropping to 1 (low) in December. May, June have high UV — SPF 30+ and sunglasses recommended.
Best months in detail
July
6/106–13°C (feels 11°C) · 14 rain days (155h) · 318 sun hours · 61% humidity · Peak crowd · UV 6 (moderate) · sunniest 1 in 10 days reach 8 (high)
August
5/105–12°C (feels 10°C) · 14 rain days (162h) · 263 sun hours · 65% humidity · Peak crowd · UV 5 (moderate) · sunniest 1 in 10 days reach 7 (high)
September
4/100–7°C (feels 4°C) · 12 rain days (153h) · 216 sun hours · 74% humidity · Moderate crowd · UV 4 (moderate) · sunniest 1 in 10 days reach 6 (moderate)
Every month
Show the other 9 months in detail
January
1/10-17–-12°C (feels -16°C) · 18 rain days (307h) · 77 sun hours · 86% humidity · Quiet crowd · UV 1 (low)
February
1/10-18–-13°C (feels -17°C) · 18 rain days (303h) · 109 sun hours · 83% humidity · Quiet crowd · UV 1 (low)
March
1/10-15–-9°C (feels -13°C) · 15 rain days (247h) · 185 sun hours · 79% humidity · Quiet crowd · UV 3 (low) · sunniest 1 in 10 days reach 4 (moderate)
April
2/10-11–-6°C (feels -10°C) · 13 rain days (214h) · 226 sun hours · 76% humidity · Quiet crowd · UV 5 (moderate) · sunniest 1 in 10 days reach 6 (high)
May
4/10-4–2°C (feels -1°C) · 12 rain days (185h) · 262 sun hours · 76% humidity · Quiet crowd · UV 7 (high) · sunniest 1 in 10 days reach 9 (very high)
June
4/101–6°C (feels 4°C) · 13 rain days (172h) · 271 sun hours · 77% humidity · Busy crowd · UV 6 (high) · sunniest 1 in 10 days reach 8 (very high)
October
2/10-8–-2°C (feels -5°C) · 15 rain days (250h) · 136 sun hours · 84% humidity · Quiet crowd · UV 2 (low) · sunniest 1 in 10 days reach 3 (moderate)
November
1/10-14–-9°C (feels -13°C) · 17 rain days (290h) · 77 sun hours · 86% humidity · Quiet crowd · UV 1 (low)
December
1/10-17–-12°C (feels -16°C) · 15 rain days (282h) · 69 sun hours · 85% humidity · Quiet crowd · UV 1 (low)
Nine dated markers show where the ice used to reach
The walk from the car park to the toe of the Athabasca Glacier passes a series of small signs set into the moraine. Each is dated, and each marks where the ice stood in that year. The earliest is 1890.
Between that marker and the present ice front lies about 1.5 km of bare rock. The glacier has lost more than half its volume in roughly 125 years, and is currently thinning by at least five metres a year at the surface, with as much as 20 metres of horizontal retreat in a warm season.
This is the rare destination where the walk to the attraction is itself the exhibit — you cover a century of retreat on foot before you reach any ice. Our monthly figures describe how cold it will be while you do it; they say nothing about how much further the ice will have gone by the time you arrive.
Sources: Parks Canada — Columbia Icefield and the Athabasca Glacier , The Globe and Mail — Athabasca glacier melting at more than five metres a year
How much time should you spend at the Athabasca Glacier?
Two to three hours covers the walk to the toe, the dated retreat markers and the Icefield Centre. Add half a day if you take an ice-explorer tour onto the glacier and the Skywalk. It sits directly on the Icefields Parkway between Banff and Jasper, so most visitors fold it into that drive.
Can you walk on the Athabasca Glacier on your own?
You can walk to the toe on the marked path, but not onto the ice unguided. Crevasses are hidden under snow bridges and there have been fatalities. Guided ice walks and the ice-explorer coaches are the sanctioned ways onto the surface, and both operate only in the summer season. Guided ice walks run in summer only and should be booked ahead; they are the sanctioned way onto the surface.
Are the Columbia Icefield and the Athabasca Glacier the same thing?
No. The Columbia Icefield is the large ice mass on the continental divide; the Athabasca Glacier is one of roughly six glaciers flowing out of it, and the one that reaches close enough to the road to be visited easily. When people say they visited the icefield, this glacier is almost always what they mean.
What is the best month to visit the Athabasca Glacier?
July and August for full access — the ice-explorer tours, the Skywalk and the Icefields Parkway services all run then, and August tops out around 12C at the ice. June and September are quieter and colder. In winter the Parkway can close in storms and the tours do not operate. Book ice-explorer tickets ahead in July and August; walk-up availability is limited at peak times.
Is the Athabasca Glacier tour worth it?
The ice-explorer takes you onto the glacier surface itself, which you cannot legally reach unguided, and that is the whole argument for it. If you only want to see the glacier and the retreat markers, the free walk from the car park delivers that. The tour is about standing on the ice.
How fast is the Athabasca Glacier retreating?
At least five metres a year of surface thinning, and in warm seasons up to about 20 metres of horizontal retreat. Since 1890 the toe has pulled back roughly 1.5 km and the glacier has lost more than half its volume. The dated markers along the approach walk make that rate legible on the ground.
What is the wettest month at the Athabasca Glacier?
July, at around 96mm, which coincides with the visitor peak — worth knowing when the walk to the toe is exposed and the weather at 2,000 m turns quickly. February is driest at about 39mm but the site is effectively a winter drive-past, with December lows near -19C. Weather at 2,000 m turns fast in any month — carry a windproof layer even for the short walk to the toe.
How cold is it at the Athabasca Glacier?
Much colder than the valley you drove from. August, the warmest month, averages only about 12C by day, and wind off the ice makes it feel sharper. December lows reach around -19C. Visitors regularly arrive in shorts from Banff and turn back — bring a windproof layer in any month. Wind off the ice is the deciding factor rather than the air temperature, and it blows almost constantly.
Is the Athabasca Glacier worth visiting?
Yes, and increasingly as a record rather than a spectacle. It is one of the most accessible glaciers in North America, reachable by a short walk from a car park on a paved highway. The dated markers make climate change measurable in paces, which is a rare thing to be able to show someone.
Where is the Athabasca Glacier?
On the Icefields Parkway in Jasper National Park, roughly halfway between Banff and Jasper townsites and about a three-hour drive from either. The Icefield Centre sits directly opposite it across the road. There is no public transport; a car or a coach tour is the only practical access.
Frequently asked questions about visiting Athabasca Glacier
When is the best time to visit Athabasca Glacier?
July is the highest-scoring month (6/10 on the Holiday Climate Index). Typical conditions: 6–13°C (14 rainy days). The top three months by score are July, August, September.
What is the worst time to visit Athabasca Glacier?
February is the lowest-scoring month (1/10, capped by extreme cold). Typical conditions: -18–-13°C (18 rainy days).
Is Athabasca Glacier too cold in winter?
6 months (January, February, March, April, November, December) cross our cold deal-breaker (apparent temperature below the cap). Doable with the right gear, but expect the climate score to be held down by the gate.
When are crowds lowest in Athabasca Glacier?
Search-interest seasonality (Google Trends 2021-2025) is lowest in January and peaks in July. Interest tracks both in-trip visitors and lead-time planners, so treat it as a "destination is on people's minds" signal rather than literal arrivals.
What is the UV index in Athabasca Glacier by month?
UV peaks at 7 (high) in May and is lowest in December at 1 (low). Monthly peak values: Jan 1, Feb 1, Mar 3, Apr 5, May 7, Jun 6, Jul 6, Aug 5, Sep 4, Oct 2, Nov 1, Dec 1.
What is the UV index in Athabasca Glacier in May?
May is the peak UV month in Athabasca Glacier, with a daily-peak UV index of 7 (high). Apply SPF 30+, wear sunglasses, and seek shade during midday hours.
How high can UV get in Athabasca Glacier on the sunniest days?
Most days look like the monthly average, but on the sunniest ~1 in 10 days UV climbs higher than the mean suggests. May is the worst case: typical days average UV 7 (high), but the top 10% of days reach UV 9 (very high) — and even higher. Months where the sunniest days routinely exceed the typical reading: March, April, May, June, July, August, September, October. Plan sun protection for the worst case, not the average.
Is air quality in Athabasca Glacier bad for travelers?
PM2.5 (fine-particle pollution) exceeds the WHO sensitive-group guideline (15 µg/m³) in 5 months: May, June, July, August, September. The worst month is July with a typical-day mean of 11 µg/m³ (moderate); on the worst 10% of days PM2.5 reaches 23 µg/m³ (unhealthy for sensitive) and higher. People with asthma, heart conditions, or sensitive children may want to avoid these months or limit outdoor activity. Source: CAMS via Open-Meteo.