Best time to visit Maligne Lake
Re-score for me — drag the dial — every chart on the page recolours live for your heat limit 27°C
Default 27 °C is the upper edge of the Holiday Climate Index "ideal comfort" band (Scott, Rutty, Amelung & Tang, 2016). Above this, most warm-tourism travellers report measurable discomfort.
Greyed factors are scored normally — extreme cold overrides them, so a clear sky or low rain can't lift the period.
Greyed factors are scored normally — extreme cold overrides them, so a clear sky or low rain can't lift the period.
Greyed factors are scored normally — extreme cold overrides them, so a clear sky or low rain can't lift the period.
Greyed factors are scored normally — extreme cold overrides them, so a clear sky or low rain can't lift the period.
Greyed factors are scored normally — extreme cold overrides them, so a clear sky or low rain can't lift the period.
Greyed factors are scored normally — extreme cold overrides them, so a clear sky or low rain can't lift the period.
Greyed factors are scored normally — extreme cold overrides them, so a clear sky or low rain can't lift the period.
Greyed factors are scored normally — extreme cold overrides them, so a clear sky or low rain can't lift the period.
Greyed factors are scored normally — extreme cold overrides them, so a clear sky or low rain can't lift the period.
Greyed factors are scored normally — extreme cold overrides them, so a clear sky or low rain can't lift the period.
Greyed factors are scored normally — extreme cold overrides them, so a clear sky or low rain can't lift the period.
Greyed factors are scored normally — extreme cold overrides them, so a clear sky or low rain can't lift the period.
Greyed factors are scored normally — extreme cold overrides them, so a clear sky or low rain can't lift the period.
Greyed factors are scored normally — extreme cold overrides them, so a clear sky or low rain can't lift the period.
Greyed factors are scored normally — extreme cold overrides them, so a clear sky or low rain can't lift the period.
Greyed factors are scored normally — extreme cold overrides them, so a clear sky or low rain can't lift the period.
Greyed factors are scored normally — extreme cold overrides them, so a clear sky or low rain can't lift the period.
Greyed factors are scored normally — extreme cold overrides them, so a clear sky or low rain can't lift the period.
Greyed factors are scored normally — extreme cold overrides them, so a clear sky or low rain can't lift the period.
Greyed factors are scored normally — extreme cold overrides them, so a clear sky or low rain can't lift the period.
Greyed factors are scored normally — extreme cold overrides them, so a clear sky or low rain can't lift the period.
Greyed factors are scored normally — extreme cold overrides them, so a clear sky or low rain can't lift the period.
Greyed factors are scored normally — extreme cold overrides them, so a clear sky or low rain can't lift the period.
Greyed factors are scored normally — extreme cold overrides them, so a clear sky or low rain can't lift the period.
Greyed factors are scored normally — extreme cold overrides them, so a clear sky or low rain can't lift the period.
Greyed factors are scored normally — extreme cold overrides them, so a clear sky or low rain can't lift the period.
Greyed factors are scored normally — extreme cold overrides them, so a clear sky or low rain can't lift the period.
Greyed factors are scored normally — extreme cold overrides them, so a clear sky or low rain can't lift the period.
Greyed factors are scored normally — extreme cold overrides them, so a clear sky or low rain can't lift the period.
Greyed factors are scored normally — extreme cold overrides them, so a clear sky or low rain can't lift the period.
Greyed factors are scored normally — extreme cold overrides them, so a clear sky or low rain can't lift the period.
Greyed factors are scored normally — extreme cold overrides them, so a clear sky or low rain can't lift the period.
Greyed factors are scored normally — extreme cold overrides them, so a clear sky or low rain can't lift the period.
Greyed factors are scored normally — extreme cold overrides them, so a clear sky or low rain can't lift the period.
Greyed factors are scored normally — extreme cold overrides them, so a clear sky or low rain can't lift the period.
Greyed factors are scored normally — extreme cold overrides them, so a clear sky or low rain can't lift the period.
Greyed factors are scored normally — extreme cold overrides them, so a clear sky or low rain can't lift the period.
Greyed factors are scored normally — extreme cold overrides them, so a clear sky or low rain can't lift the period.
Greyed factors are scored normally — extreme cold overrides them, so a clear sky or low rain can't lift the period.
Greyed factors are scored normally — extreme cold overrides them, so a clear sky or low rain can't lift the period.
Greyed factors are scored normally — extreme cold overrides them, so a clear sky or low rain can't lift the period.
How is this scored? HCI / Steadman / CCI gate — full methodology and citations below.
Compare with another destination
Add as many as you like — stacked below the main strips above. Each row is just the recent-window score strip and (for beach destinations) sea-temperature strip.
Tours in Maligne Lake
26 top-rated tours via Viator. Booking links earn this site a commission at no cost to you. Map locations are approximate (centred on Maligne Lake).
- 1
 Jasper Wildlife & Sightseeing Tour with Maligne Lake Cruise
 - 2
 Maligne Lake Cruise
 - 3
 Jasper National Park Tour: Maligne Valley, Medicine Lake and Spirit Island
 - 4
 Jasper Wildlife and Sightseeing Tour with Maligne Lake Hike
 - 5
 Rockies Western Canada Iconic Sites Tour
 - 6
 Explore Jasper Tour with Maligne Lake Cruise
 - 7
 Icefields Parkway: a Smartphone Audio Driving Tour
 - 8
 Self-Guided Audio Tours for the Canadian Rockies
 - 9
 [XP Planet] 5-Day Rockies Tour with Glacier View Lodge Stay
 - 10
 5 Day Canadian Rockies, Banff, Lake Louise, Moraine Lake, Jasper
 - 11
 4-Day Rockies Tour: Banff,Jasper, Yoho,Lake Louise, Moraine Lake
 - 12
 4-Day Banff, Lake Louise, Jasper, Icefield Packaged Tour
 - 13
 5-Days: Banff,Jasper, Yoho,Lake Louise, Moraine Lake,Icefield
 - 14
 [XP Planet] 4-Day Rockies Tour with Glacier View Lodge Stay
 - 15
 [XP Planet] 4-Day Rockies Tour with Glacier View Lodge Stay
 - 16
 3-Day Canadian Rockies Tour: Yoho & Jasper National Park
 - 17
 3-Day Glacial Tour package, Columbia Icefield, Jasper, LakeLouise
 - 18
 6 Day Premium Rocky Rail Adventure: YVR to YYC Rocky Mountaineer
 - 19
 3-Day Columbia Icefield & Jasper Tour from Calgary,airport pickup
 - 20
 Jasper National Park 2-Day Tour: Maligne Lake & Columbia Icefield
 - 21Self-Guided Audio Driving Tour in Jasper National Park
- 226-Day Rockies & Drumheller Tour: Banff, Jasper, Icefields Parkway
- 23
 4 Days Private Tour to Banff and Jasper National Park
 - 24
 16 Days Premium Tour in Western Canada and Vancouver Island
 - 25
 Banff, Yoho, and Jasper 2 Day Private Tour
 - 26
 5 Day Tour Banff Yoho Jasper w/ 1night Icefield Parkway
Last refreshed 2026-08-13.
Similar climatesMoraine Lake96% · Lake Louise93% · Yellowstone87%
Other destinations with the most-alike year-round climate to Maligne Lake (apparent temperature, rain hours, sunshine — matched within the same trip-profile). The ±N chip compares each match's typical score for the current month against Maligne Lake's. Based on the 2020-2024 climatology, not this year's actual weather.
Month-by-month
| Month | Temp °C | Feels °C | Rain days | Rain h | Rain h/day | Humidity | Wind km/h | Sun h | UV | Interest | Score |
|---|---|---|---|---|---|---|---|---|---|---|---|
| Jan | -15–-8 | -13 | 12 | 176 | 14.7 | 79% | 11 | 113 | 1 | Quiet | 2 |
| Feb | -14–-7 | -12 | 14 | 232 | 16.6 | 73% | 12 | 127 | 1 | Quiet | 2 |
| Mar | -12–-3 | -7 | 13 | 176 | 13.5 | 64% | 12 | 206 | 3 | Quiet | 3 |
| Apr | -8–1 | -3 | 12 | 177 | 14.8 | 60% | 13 | 240 | 4 | Quiet | 4 |
| May | -1–8 | 5 | 14 | 198 | 14.1 | 60% | 12 | 262 | 6 | Quiet | 4 |
| Jun | 3–12 | 10 | 14 | 187 | 13.4 | 62% | 12 | 272 | 6 | Busy | 5 |
| Jul | 8–18 | 16 | 17 | 191 | 11.2 | 54% | 14 | 320 | 6 | Peak | 6 |
| Aug | 7–17 | 15 | 13 | 164 | 12.6 | 57% | 14 | 266 | 5 | Busy | 7 |
| Sep | 3–13 | 10 | 12 | 147 | 12.3 | 64% | 14 | 224 | 4 | Moderate | 6 |
| Oct | -4–4 | 0 | 13 | 184 | 14.2 | 74% | 13 | 163 | 2 | Quiet | 4 |
| Nov | -11–-4 | -9 | 12 | 187 | 15.6 | 80% | 12 | 109 | 1 | Quiet | 3 |
| Dec | -15–-8 | -13 | 12 | 174 | 14.5 | 80% | 11 | 92 | 1 | Quiet | 2 |
UV Index in Maligne Lake by Month
UV index in Maligne Lake peaks at 6 (moderate) in May, dropping to 1 (low) in December.
Best months in detail
August
7/107–17°C (feels 15°C) · 13 rain days (164h) · 266 sun hours · 57% humidity · Busy crowd · UV 5 (moderate) · sunniest 1 in 10 days reach 7 (high)
July
6/108–18°C (feels 16°C) · 17 rain days (191h) · 320 sun hours · 54% humidity · Peak crowd · UV 6 (moderate) · sunniest 1 in 10 days reach 8 (high)
September
6/103–13°C (feels 10°C) · 12 rain days (147h) · 224 sun hours · 64% humidity · Moderate crowd · UV 4 (moderate) · sunniest 1 in 10 days reach 5 (moderate)
Every month
Show the other 9 months in detail
January
2/10-15–-8°C (feels -13°C) · 12 rain days (176h) · 113 sun hours · 79% humidity · Quiet crowd · UV 1 (low)
February
2/10-14–-7°C (feels -12°C) · 14 rain days (232h) · 127 sun hours · 73% humidity · Quiet crowd · UV 1 (low)
March
3/10-12–-3°C (feels -7°C) · 13 rain days (176h) · 206 sun hours · 64% humidity · Quiet crowd · UV 3 (low) · sunniest 1 in 10 days reach 4 (moderate)
April
4/10-8–1°C (feels -3°C) · 12 rain days (177h) · 240 sun hours · 60% humidity · Quiet crowd · UV 4 (moderate) · sunniest 1 in 10 days reach 6 (high)
May
4/10-1–8°C (feels 5°C) · 14 rain days (198h) · 262 sun hours · 60% humidity · Quiet crowd · UV 6 (moderate) · sunniest 1 in 10 days reach 8 (high)
June
5/103–12°C (feels 10°C) · 14 rain days (187h) · 272 sun hours · 62% humidity · Busy crowd · UV 6 (moderate) · sunniest 1 in 10 days reach 8 (high)
October
4/10-4–4°C (feels 0°C) · 13 rain days (184h) · 163 sun hours · 74% humidity · Quiet crowd · UV 2 (low) · sunniest 1 in 10 days reach 3 (moderate)
November
3/10-11–-4°C (feels -9°C) · 12 rain days (187h) · 109 sun hours · 80% humidity · Quiet crowd · UV 1 (low)
December
2/10-15–-8°C (feels -13°C) · 12 rain days (174h) · 92 sun hours · 80% humidity · Quiet crowd · UV 1 (low)
Frequently asked questions about visiting Maligne Lake
When is the best time to visit Maligne Lake?
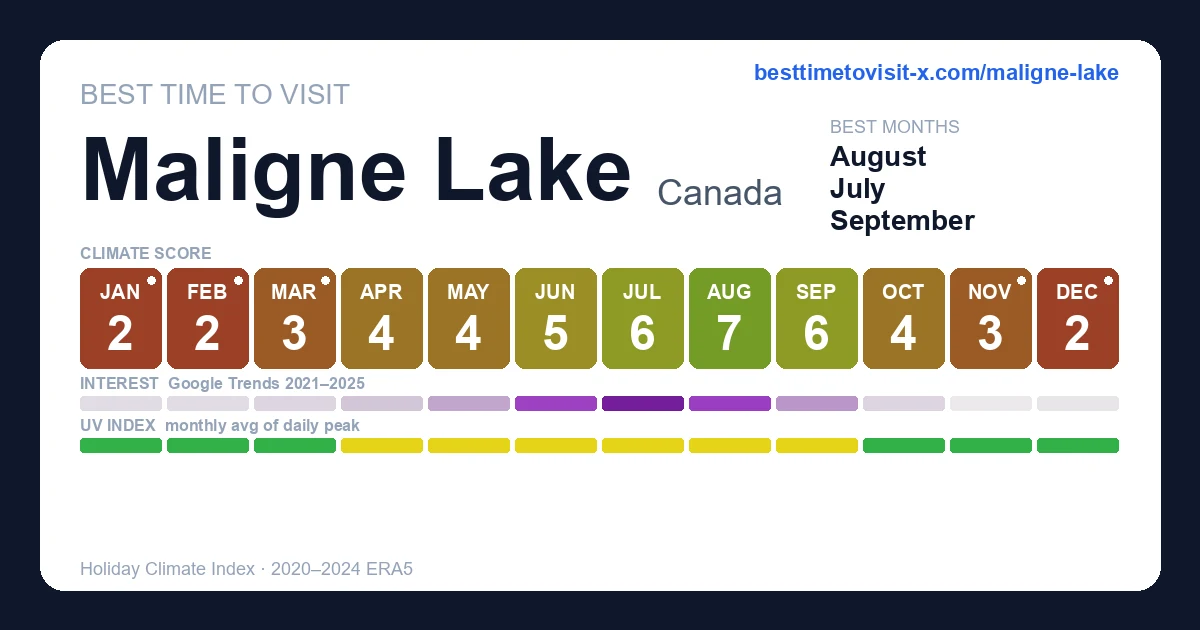
August is the highest-scoring month (7/10 on the Holiday Climate Index). Typical conditions: 7–17°C (13 rainy days). The top three months by score are August, July, September.
What is the worst time to visit Maligne Lake?
February is the lowest-scoring month (2/10, capped by extreme cold). Typical conditions: -14–-7°C (14 rainy days).
Is Maligne Lake too cold in winter?
5 months (January, February, March, November, December) cross our cold deal-breaker (apparent temperature below the cap). Doable with the right gear, but expect the climate score to be held down by the gate.
When are crowds lowest in Maligne Lake?
Search-interest seasonality (Google Trends 2021-2025) is lowest in November and peaks in July. Interest tracks both in-trip visitors and lead-time planners, so treat it as a "destination is on people's minds" signal rather than literal arrivals.
Which months in Maligne Lake have good weather but fewer tourists?
September (climate 6/10, crowd index 41) — shoulder months with above-average climate and below-median search-interest. Often the best value-for-weather trade.
What is the UV index in Maligne Lake by month?
UV peaks at 6 (moderate) in May and is lowest in December at 1 (low). Monthly peak values: Jan 1, Feb 1, Mar 3, Apr 4, May 6, Jun 6, Jul 6, Aug 5, Sep 4, Oct 2, Nov 1, Dec 1.
What is the UV index in Maligne Lake in May?
May is the peak UV month in Maligne Lake, with a daily-peak UV index of 6 (moderate). Standard sun protection — sunglasses and light SPF — is recommended.
How high can UV get in Maligne Lake on the sunniest days?
Most days look like the monthly average, but on the sunniest ~1 in 10 days UV climbs higher than the mean suggests. June is the worst case: typical days average UV 6 (moderate), but the top 10% of days reach UV 8 (high) — and even higher. Months where the sunniest days routinely exceed the typical reading: March, April, May, June, July, August, September, October. Plan sun protection for the worst case, not the average.
Is air quality in Maligne Lake bad for travelers?
PM2.5 (fine-particle pollution) exceeds the WHO sensitive-group guideline (15 µg/m³) in 2 months: July, September. The worst month is July with a typical-day mean of 11 µg/m³ (moderate); on the worst 10% of days PM2.5 reaches 24 µg/m³ (unhealthy for sensitive) and higher. People with asthma, heart conditions, or sensitive children may want to avoid these months or limit outdoor activity. Source: CAMS via Open-Meteo.