Best time to visit Zanzibar
Re-score for me — drag the dial — every chart recolours live for your heat & sea limits 27°C · sea 29°C
Default 27 °C is the upper edge of the Holiday Climate Index "ideal comfort" band (Scott, Rutty, Amelung & Tang, 2016). Above this, most warm-tourism travellers report measurable discomfort.
Default 29 °C is the Beach Climate Index "bathtub" line (Morgan et al.) — where the sea stops being refreshing and starts feeling like a warm bath.
Greyed factors are scored normally — extreme heat overrides them, so a clear sky or low rain can't lift the period.
Greyed factors are scored normally — extreme heat overrides them, so a clear sky or low rain can't lift the period.
Greyed factors are scored normally — extreme heat overrides them, so a clear sky or low rain can't lift the period.
Greyed factors are scored normally — extreme heat overrides them, so a clear sky or low rain can't lift the period.
Greyed factors are scored normally — extreme heat overrides them, so a clear sky or low rain can't lift the period.
Greyed factors are scored normally — extreme heat overrides them, so a clear sky or low rain can't lift the period.
Greyed factors are scored normally — extreme heat overrides them, so a clear sky or low rain can't lift the period.
Greyed factors are scored normally — extreme heat overrides them, so a clear sky or low rain can't lift the period.
Greyed factors are scored normally — extreme heat overrides them, so a clear sky or low rain can't lift the period.
Greyed factors are scored normally — extreme heat overrides them, so a clear sky or low rain can't lift the period.
Greyed factors are scored normally — extreme heat overrides them, so a clear sky or low rain can't lift the period.
Greyed factors are scored normally — extreme heat overrides them, so a clear sky or low rain can't lift the period.
Greyed factors are scored normally — extreme heat overrides them, so a clear sky or low rain can't lift the period.
Greyed factors are scored normally — extreme heat overrides them, so a clear sky or low rain can't lift the period.
Greyed factors are scored normally — extreme heat overrides them, so a clear sky or low rain can't lift the period.
Greyed factors are scored normally — extreme heat overrides them, so a clear sky or low rain can't lift the period.
Greyed factors are scored normally — extreme heat overrides them, so a clear sky or low rain can't lift the period.
Greyed factors are scored normally — extreme heat overrides them, so a clear sky or low rain can't lift the period.
Greyed factors are scored normally — extreme heat overrides them, so a clear sky or low rain can't lift the period.
Greyed factors are scored normally — extreme heat overrides them, so a clear sky or low rain can't lift the period.
Greyed factors are scored normally — extreme heat overrides them, so a clear sky or low rain can't lift the period.
Greyed factors are scored normally — extreme heat overrides them, so a clear sky or low rain can't lift the period.
Greyed factors are scored normally — extreme heat overrides them, so a clear sky or low rain can't lift the period.
Greyed factors are scored normally — extreme heat overrides them, so a clear sky or low rain can't lift the period.
Greyed factors are scored normally — extreme heat overrides them, so a clear sky or low rain can't lift the period.
Greyed factors are scored normally — extreme heat overrides them, so a clear sky or low rain can't lift the period.
Greyed factors are scored normally — extreme heat overrides them, so a clear sky or low rain can't lift the period.
Greyed factors are scored normally — extreme heat overrides them, so a clear sky or low rain can't lift the period.
Greyed factors are scored normally — extreme heat overrides them, so a clear sky or low rain can't lift the period.
Greyed factors are scored normally — extreme heat overrides them, so a clear sky or low rain can't lift the period.
Greyed factors are scored normally — extreme heat overrides them, so a clear sky or low rain can't lift the period.
Greyed factors are scored normally — extreme heat overrides them, so a clear sky or low rain can't lift the period.
Greyed factors are scored normally — extreme heat overrides them, so a clear sky or low rain can't lift the period.
Greyed factors are scored normally — extreme heat overrides them, so a clear sky or low rain can't lift the period.
Greyed factors are scored normally — extreme heat overrides them, so a clear sky or low rain can't lift the period.
Greyed factors are scored normally — extreme heat overrides them, so a clear sky or low rain can't lift the period.
Greyed factors are scored normally — extreme heat overrides them, so a clear sky or low rain can't lift the period.
Greyed factors are scored normally — extreme heat overrides them, so a clear sky or low rain can't lift the period.
Greyed factors are scored normally — extreme heat overrides them, so a clear sky or low rain can't lift the period.
Greyed factors are scored normally — extreme heat overrides them, so a clear sky or low rain can't lift the period.
Greyed factors are scored normally — extreme heat overrides them, so a clear sky or low rain can't lift the period.
Greyed factors are scored normally — extreme heat overrides them, so a clear sky or low rain can't lift the period.
Greyed factors are scored normally — extreme heat overrides them, so a clear sky or low rain can't lift the period.
Greyed factors are scored normally — extreme heat overrides them, so a clear sky or low rain can't lift the period.
Greyed factors are scored normally — extreme heat overrides them, so a clear sky or low rain can't lift the period.
Greyed factors are scored normally — extreme heat overrides them, so a clear sky or low rain can't lift the period.
Greyed factors are scored normally — extreme heat overrides them, so a clear sky or low rain can't lift the period.
Greyed factors are scored normally — extreme heat overrides them, so a clear sky or low rain can't lift the period.
Greyed factors are scored normally — extreme heat overrides them, so a clear sky or low rain can't lift the period.
Greyed factors are scored normally — extreme heat overrides them, so a clear sky or low rain can't lift the period.
Greyed factors are scored normally — extreme heat overrides them, so a clear sky or low rain can't lift the period.
Greyed factors are scored normally — extreme heat overrides them, so a clear sky or low rain can't lift the period.
Greyed factors are scored normally — extreme heat overrides them, so a clear sky or low rain can't lift the period.
Greyed factors are scored normally — extreme heat overrides them, so a clear sky or low rain can't lift the period.
Greyed factors are scored normally — extreme heat overrides them, so a clear sky or low rain can't lift the period.
Greyed factors are scored normally — extreme heat overrides them, so a clear sky or low rain can't lift the period.
Greyed factors are scored normally — extreme heat overrides them, so a clear sky or low rain can't lift the period.
Greyed factors are scored normally — extreme heat overrides them, so a clear sky or low rain can't lift the period.
Greyed factors are scored normally — extreme heat overrides them, so a clear sky or low rain can't lift the period.
Greyed factors are scored normally — extreme heat overrides them, so a clear sky or low rain can't lift the period.
Greyed factors are scored normally — extreme heat overrides them, so a clear sky or low rain can't lift the period.
Greyed factors are scored normally — extreme heat overrides them, so a clear sky or low rain can't lift the period.
Greyed factors are scored normally — extreme heat overrides them, so a clear sky or low rain can't lift the period.
Greyed factors are scored normally — extreme heat overrides them, so a clear sky or low rain can't lift the period.
Greyed factors are scored normally — extreme heat overrides them, so a clear sky or low rain can't lift the period.
Greyed factors are scored normally — extreme heat overrides them, so a clear sky or low rain can't lift the period.
Greyed factors are scored normally — extreme heat overrides them, so a clear sky or low rain can't lift the period.
Greyed factors are scored normally — extreme heat overrides them, so a clear sky or low rain can't lift the period.
Greyed factors are scored normally — extreme heat overrides them, so a clear sky or low rain can't lift the period.
Greyed factors are scored normally — extreme heat overrides them, so a clear sky or low rain can't lift the period.
Greyed factors are scored normally — extreme heat overrides them, so a clear sky or low rain can't lift the period.
Greyed factors are scored normally — extreme heat overrides them, so a clear sky or low rain can't lift the period.
Greyed factors are scored normally — extreme heat overrides them, so a clear sky or low rain can't lift the period.
Greyed factors are scored normally — extreme heat overrides them, so a clear sky or low rain can't lift the period.
Greyed factors are scored normally — extreme heat overrides them, so a clear sky or low rain can't lift the period.
Greyed factors are scored normally — extreme heat overrides them, so a clear sky or low rain can't lift the period.
Greyed factors are scored normally — extreme heat overrides them, so a clear sky or low rain can't lift the period.
Greyed factors are scored normally — extreme heat overrides them, so a clear sky or low rain can't lift the period.
Greyed factors are scored normally — extreme heat overrides them, so a clear sky or low rain can't lift the period.
How is this scored? HCI / Steadman / CCI gate — full methodology and citations below.
Compare with another destination
Add as many as you like — stacked below the main strips above. Each row is just the recent-window score strip and (for beach destinations) sea-temperature strip.
Tours in Zanzibar
6 top-rated tours via Viator. Booking links earn this site a commission at no cost to you. Map locations are approximate (centred on Zanzibar).
- 1
 Skydive Zanzibar | Tandem Skydive
 - 2
 3 Hours Private Stone Town Walking Tour
 - 3
 Stone Town Walking Tour in Zanzibar
 - 4
 Jozani Forest, Salaam Cave and The Rock Restaurant in Zanzibar
 - 5
 Salaam Cave and Jozani Forest Guided Tour
 - 6
 Full-Day Zanzibar Dolphins, Turtle Salaam Cave & Jozani Forest
Last refreshed 2026-06-30.
Similar climatesSan Juan74% · Male74% · Punta Cana73%
Other destinations with the most-alike year-round climate to Zanzibar (apparent temperature, rain hours, sunshine — matched within the same trip-profile). The ±N chip compares each match's typical score for the current month against Zanzibar's. Based on the 2020-2024 climatology, not this year's actual weather.
Month-by-month
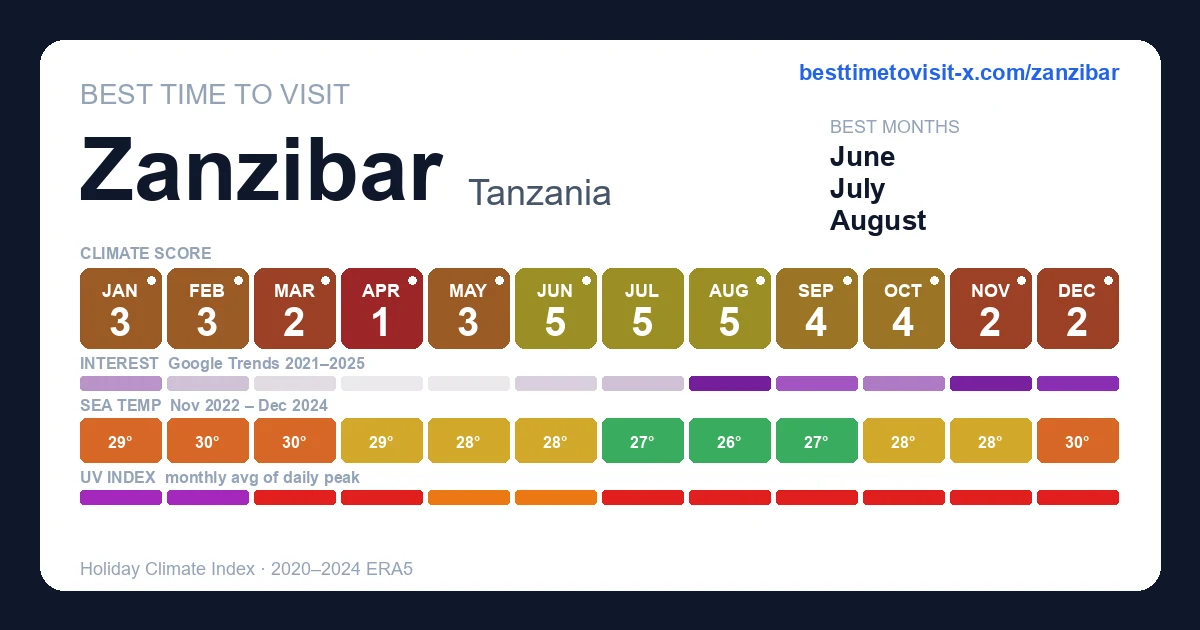
| Month | Temp °C | Feels °C | Rain days | Rain h | Rain h/day | Humidity | Wind km/h | Sun h | UV | Interest | Score |
|---|---|---|---|---|---|---|---|---|---|---|---|
| Jan | 25–32 | 35 | 15 | 158 | 10.5 | 64% | 19 | 254 | 11 | Peak | 3 |
| Feb | 26–33 | 36 | 15 | 133 | 8.9 | 61% | 17 | 231 | 12 | Busy | 3 |
| Mar | 25–32 | 36 | 18 | 219 | 12.2 | 64% | 16 | 245 | 11 | Moderate | 2 |
| Apr | 25–29 | 33 | 27 | 444 | 16.4 | 80% | 17 | 174 | 8 | Quiet | 1 |
| May | 24–28 | 31 | 18 | 245 | 13.6 | 73% | 20 | 237 | 8 | Quiet | 3 |
| Jun | 23–28 | 30 | 16 | 189 | 11.8 | 68% | 21 | 232 | 8 | Quiet | 5 |
| Jul | 22–28 | 29 | 17 | 195 | 11.5 | 66% | 22 | 245 | 8 | Moderate | 5 |
| Aug | 22–29 | 30 | 17 | 176 | 10.4 | 61% | 20 | 252 | 9 | Busy | 5 |
| Sep | 22–30 | 32 | 16 | 175 | 10.9 | 58% | 19 | 255 | 10 | Moderate | 4 |
| Oct | 23–31 | 33 | 17 | 183 | 10.8 | 59% | 18 | 267 | 10 | Moderate | 4 |
| Nov | 24–30 | 34 | 24 | 254 | 10.6 | 66% | 16 | 249 | 10 | Moderate | 2 |
| Dec | 25–31 | 35 | 21 | 232 | 11.0 | 68% | 16 | 270 | 10 | Busy | 2 |
UV Index in Zanzibar by Month
UV index in Zanzibar peaks at 12 (extreme) in February, dropping to 8 (high) in June. January, February, March, April, July, August, September, October, November, December reach very high or extreme levels — apply SPF 50+, wear a hat and protective clothing, and limit direct sun between 11:00 and 17:00.
Best months in detail
July
5/1022–28°C (feels 29°C) · 17 rain days (195h) · 245 sun hours · 66% humidity · Moderate crowd · UV 8 (very high)
August
5/1022–29°C (feels 30°C) · 17 rain days (176h) · 252 sun hours · 61% humidity · Busy crowd · UV 9 (very high)
June
5/1023–28°C (feels 30°C) · 16 rain days (189h) · 232 sun hours · 68% humidity · Quiet crowd · UV 8 (high) · sunniest 1 in 10 days reach 9 (very high)
Every month
Show the other 9 months in detail
January
3/1025–32°C (feels 35°C) · 15 rain days (158h) · 254 sun hours · 64% humidity · Peak crowd · UV 11 (extreme) · sunniest 1 in 10 days reach 13 (extreme)
February
3/1026–33°C (feels 36°C) · 15 rain days (133h) · 231 sun hours · 61% humidity · Busy crowd · UV 12 (extreme) · sunniest 1 in 10 days reach 13 (extreme)
March
2/1025–32°C (feels 36°C) · 18 rain days (219h) · 245 sun hours · 64% humidity · Moderate crowd · UV 11 (very high) · sunniest 1 in 10 days reach 13 (extreme)
April
1/1025–29°C (feels 33°C) · 27 rain days (444h) · 174 sun hours · 80% humidity · Quiet crowd · UV 8 (very high) · sunniest 1 in 10 days reach 11 (very high)
May
3/1024–28°C (feels 31°C) · 18 rain days (245h) · 237 sun hours · 73% humidity · Quiet crowd · UV 8 (high) · sunniest 1 in 10 days reach 10 (very high)
September
4/1022–30°C (feels 32°C) · 16 rain days (175h) · 255 sun hours · 58% humidity · Moderate crowd · UV 10 (very high) · sunniest 1 in 10 days reach 12 (extreme)
October
4/1023–31°C (feels 33°C) · 17 rain days (183h) · 267 sun hours · 59% humidity · Moderate crowd · UV 10 (very high) · sunniest 1 in 10 days reach 12 (extreme)
November
2/1024–30°C (feels 34°C) · 24 rain days (254h) · 249 sun hours · 66% humidity · Moderate crowd · UV 10 (very high) · sunniest 1 in 10 days reach 12 (extreme)
December
2/1025–31°C (feels 35°C) · 21 rain days (232h) · 270 sun hours · 68% humidity · Busy crowd · UV 10 (very high) · sunniest 1 in 10 days reach 12 (extreme)
The biggest constraint on your trip moves 11 days earlier every year
Zanzibar's most consequential seasonal variable is not the rain. It is Ramadan, and it does not sit still on the calendar.
The Zanzibar Commission for Tourism issues a binding notice each year requiring restaurants, bars and food outlets outside hotel compounds to close during daylight hours for the whole month, with alcohol sales suspended except in licensed tourist hotels. Hotel dining continues for registered guests on the premises. Eating, drinking and smoking in public during daylight are restricted, and modest dress is asked for outside the beaches.
Because the Islamic calendar is lunar, that month arrives roughly 11 days earlier each Gregorian year — so it walks steadily through the climate chart. At present it falls inside the February dry window, which is exactly the period a temperature table would nominate. The start is confirmed by local moon sighting the evening before, not months ahead.
Sources: The Citizen — Zanzibar issues Ramadhan guidelines for tourism businesses , UK FCDO — Tanzania travel advice, entry requirements
What is the best time to visit Zanzibar?
June to October, the long dry season, which is also when the humidity is most bearable. January and February are the second dry window but currently coincide with Ramadan, which closes much of the daytime food scene outside hotels. Avoid March to May, when the long rains peak — April alone averages around 385 mm.
Does Zanzibar have a rainy season?
Two. The long rains, masika, run March to May and peak in April at around 385 mm — heavy enough that some smaller places close. The short rains, vuli, fall roughly November to December, with November around 216 mm. Between them sit two dry windows: January to February, and June to October.
What happens in Zanzibar during Ramadan?
The tourism commission requires restaurants, bars and food outlets outside hotel compounds to close during daylight, with alcohol suspended except in licensed tourist hotels. Hotel dining continues for registered guests on-site. Eating, drinking or smoking in public during daylight is restricted and modest dress is requested away from beaches.
When is Ramadan in Zanzibar?
It moves about 11 days earlier each Gregorian year because the Islamic calendar is lunar, and the exact start is confirmed by local moon sighting the evening before rather than fixed in advance. In recent years it has fallen in February and March. Check the dates for your specific year before booking.
Do you need insurance to enter Zanzibar?
Yes. Since October 2024 all non-resident visitors must hold mandatory inbound travel insurance issued by the Zanzibar Insurance Corporation for the duration of their stay, and other international policies are not accepted — you can be refused entry without it. It costs around US$44 for an adult and about half that for children.
Is Zanzibar Muslim?
Overwhelmingly, which is why the Ramadan measures apply archipelago-wide rather than in particular districts, and why modest dress away from the beach is expected year-round. Beachwear is fine on beaches and inside hotel grounds; covering shoulders and knees in Stone Town and villages is the normal courtesy.
What are the tides like in Zanzibar?
Semidiurnal and large. Measurements on the east coast show a spring tidal range of roughly 3.2 m against about 1 m at neaps, so the water on the east-coast beaches goes a very long way out and comes a long way in. Swimming windows there are governed by the tide table rather than the clock.
How many days do you need in Zanzibar?
Seven. Two for Stone Town, which is UNESCO-listed and worth more than a rushed afternoon, and four or five on a beach — the east coast for tides and kitesurfing, the north around Nungwi for swimming at any state of tide. Add days if you want Jozani forest or a spice tour.
Is Stone Town worth visiting?
Yes — it is UNESCO-listed and the historic heart of the archipelago, a dense maze of Swahili, Arab, Indian and European building traditions. It rewards getting lost on foot. Note that it is also where the Ramadan daytime closures bite hardest, since most of its restaurants sit outside hotel compounds.
When is the hottest month in Zanzibar?
The equatorial climate keeps temperatures high and flat year-round, so the meaningful variable is rain and humidity rather than heat. The most comfortable stretch is June to October, when the long dry season coincides with lower humidity. The wettest and heaviest-feeling months are March through May.
Frequently asked questions about visiting Zanzibar
When is the best time to visit Zanzibar?
July is the highest-scoring month (5/10 on the Holiday Climate Index). Typical conditions: 22–28°C (17 rainy days). The top three months by score are July, August, June.
What is the worst time to visit Zanzibar?
April is the lowest-scoring month (1/10, capped by extreme heat). Typical conditions: 25–29°C (27 rainy days).
Is Zanzibar too hot in summer?
11 months (January, February, March, April, May, June, August, September, October, November, December) trip the heat deal-breaker in our scoring: apparent temperature crosses the comfort cap, so even with clear skies and low rain the score is held down. Plan around it if heat tolerance is low.
When are crowds lowest in Zanzibar?
Search-interest seasonality (Google Trends 2021-2025) is lowest in May and peaks in January. Interest tracks both in-trip visitors and lead-time planners, so treat it as a "destination is on people's minds" signal rather than literal arrivals.
What is the UV index in Zanzibar by month?
UV peaks at 12 (extreme) in February and is lowest in June at 8 (high). Monthly peak values: Jan 11, Feb 12, Mar 11, Apr 8, May 8, Jun 8, Jul 8, Aug 9, Sep 10, Oct 10, Nov 10, Dec 10. January, February, March, April, July, August, September, October, November, December reach very high or extreme levels — apply SPF 50+, wear a hat and protective clothing, and limit direct sun between 11:00 and 17:00.
What is the UV index in Zanzibar in February?
February is the peak UV month in Zanzibar, with a daily-peak UV index of 12 (extreme). At this level, sunburn can occur in under 20 minutes on unprotected fair skin. Apply SPF 50+, wear protective clothing and a hat, and avoid direct midday sun (11:00–17:00).
How high can UV get in Zanzibar on the sunniest days?
Most days look like the monthly average, but on the sunniest ~1 in 10 days UV climbs higher than the mean suggests. February is the worst case: typical days average UV 12 (extreme), but the top 10% of days reach UV 13 (extreme) — and even higher. Months where the sunniest days routinely exceed the typical reading: January, February, March, April, May, June, September, October, November, December. Plan sun protection for the worst case, not the average.
Is air quality in Zanzibar bad for travelers?
PM2.5 (fine-particle pollution) exceeds the WHO sensitive-group guideline (15 µg/m³) in 1 month: February. The worst month is January with a typical-day mean of 12 µg/m³ (moderate); on the worst 10% of days PM2.5 reaches 15 µg/m³ (moderate) and higher. People with asthma, heart conditions, or sensitive children may want to avoid these months or limit outdoor activity. Source: CAMS via Open-Meteo.