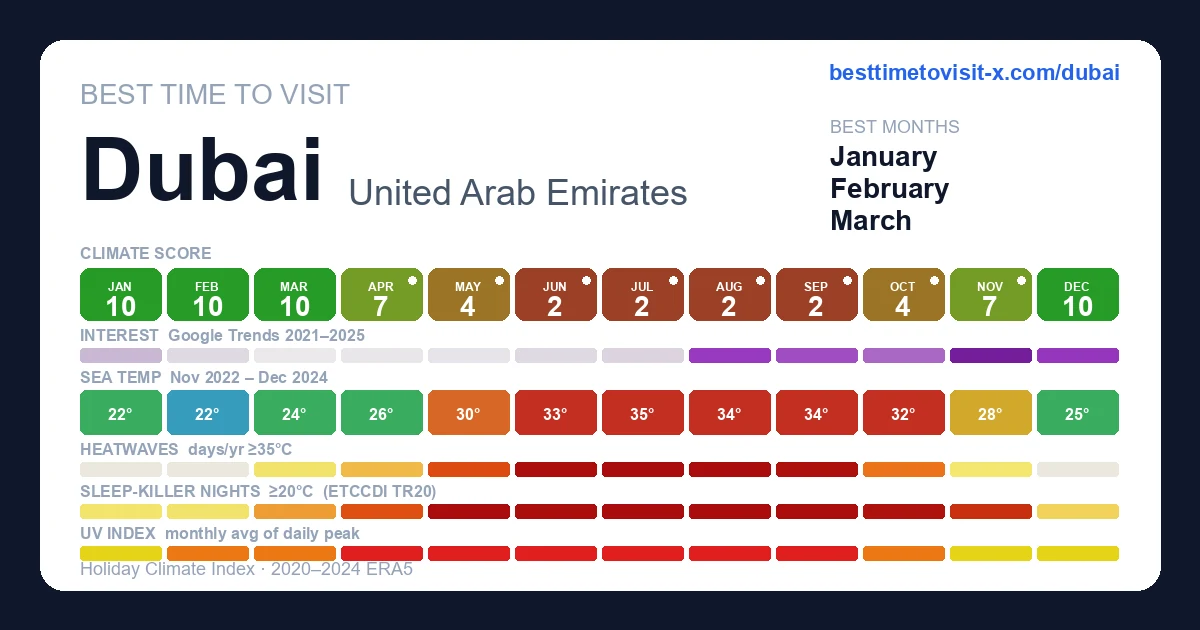
Best time to visit Dubai
Re-score for me — drag the dial — every chart recolours live for your heat & sea limits 27°C · sea 29°C
Default 27 °C is the upper edge of the Holiday Climate Index "ideal comfort" band (Scott, Rutty, Amelung & Tang, 2016). Above this, most warm-tourism travellers report measurable discomfort.
Default 29 °C is the Beach Climate Index "bathtub" line (Morgan et al.) — where the sea stops being refreshing and starts feeling like a warm bath.
Greyed factors are scored normally — extreme heat overrides them, so a clear sky or low rain can't lift the period.
Greyed factors are scored normally — extreme heat overrides them, so a clear sky or low rain can't lift the period.
Greyed factors are scored normally — extreme heat overrides them, so a clear sky or low rain can't lift the period.
Greyed factors are scored normally — extreme heat overrides them, so a clear sky or low rain can't lift the period.
Greyed factors are scored normally — extreme heat overrides them, so a clear sky or low rain can't lift the period.
Greyed factors are scored normally — extreme heat overrides them, so a clear sky or low rain can't lift the period.
Greyed factors are scored normally — extreme heat overrides them, so a clear sky or low rain can't lift the period.
Greyed factors are scored normally — extreme heat overrides them, so a clear sky or low rain can't lift the period.
Greyed factors are scored normally — extreme heat overrides them, so a clear sky or low rain can't lift the period.
Greyed factors are scored normally — extreme heat overrides them, so a clear sky or low rain can't lift the period.
Greyed factors are scored normally — extreme heat overrides them, so a clear sky or low rain can't lift the period.
Greyed factors are scored normally — extreme heat overrides them, so a clear sky or low rain can't lift the period.
Greyed factors are scored normally — extreme heat overrides them, so a clear sky or low rain can't lift the period.
Greyed factors are scored normally — extreme heat overrides them, so a clear sky or low rain can't lift the period.
Greyed factors are scored normally — extreme heat overrides them, so a clear sky or low rain can't lift the period.
Greyed factors are scored normally — extreme heat overrides them, so a clear sky or low rain can't lift the period.
Greyed factors are scored normally — extreme heat overrides them, so a clear sky or low rain can't lift the period.
Greyed factors are scored normally — extreme heat overrides them, so a clear sky or low rain can't lift the period.
Greyed factors are scored normally — extreme heat overrides them, so a clear sky or low rain can't lift the period.
Greyed factors are scored normally — extreme heat overrides them, so a clear sky or low rain can't lift the period.
Greyed factors are scored normally — extreme heat overrides them, so a clear sky or low rain can't lift the period.
Greyed factors are scored normally — extreme heat overrides them, so a clear sky or low rain can't lift the period.
Greyed factors are scored normally — extreme heat overrides them, so a clear sky or low rain can't lift the period.
Greyed factors are scored normally — extreme heat overrides them, so a clear sky or low rain can't lift the period.
Greyed factors are scored normally — extreme heat overrides them, so a clear sky or low rain can't lift the period.
Greyed factors are scored normally — extreme heat overrides them, so a clear sky or low rain can't lift the period.
Greyed factors are scored normally — extreme heat overrides them, so a clear sky or low rain can't lift the period.
Greyed factors are scored normally — extreme heat overrides them, so a clear sky or low rain can't lift the period.
Greyed factors are scored normally — extreme heat overrides them, so a clear sky or low rain can't lift the period.
Greyed factors are scored normally — extreme heat overrides them, so a clear sky or low rain can't lift the period.
Greyed factors are scored normally — extreme heat overrides them, so a clear sky or low rain can't lift the period.
Greyed factors are scored normally — extreme heat overrides them, so a clear sky or low rain can't lift the period.
Greyed factors are scored normally — extreme heat overrides them, so a clear sky or low rain can't lift the period.
Greyed factors are scored normally — extreme heat overrides them, so a clear sky or low rain can't lift the period.
Greyed factors are scored normally — extreme heat overrides them, so a clear sky or low rain can't lift the period.
Greyed factors are scored normally — extreme heat overrides them, so a clear sky or low rain can't lift the period.
Greyed factors are scored normally — extreme heat overrides them, so a clear sky or low rain can't lift the period.
Greyed factors are scored normally — extreme heat overrides them, so a clear sky or low rain can't lift the period.
Greyed factors are scored normally — extreme heat overrides them, so a clear sky or low rain can't lift the period.
Greyed factors are scored normally — extreme heat overrides them, so a clear sky or low rain can't lift the period.
Greyed factors are scored normally — extreme heat overrides them, so a clear sky or low rain can't lift the period.
Greyed factors are scored normally — extreme heat overrides them, so a clear sky or low rain can't lift the period.
Greyed factors are scored normally — extreme heat overrides them, so a clear sky or low rain can't lift the period.
Greyed factors are scored normally — extreme heat overrides them, so a clear sky or low rain can't lift the period.
Greyed factors are scored normally — extreme heat overrides them, so a clear sky or low rain can't lift the period.
Greyed factors are scored normally — extreme heat overrides them, so a clear sky or low rain can't lift the period.
Greyed factors are scored normally — extreme heat overrides them, so a clear sky or low rain can't lift the period.
Greyed factors are scored normally — extreme heat overrides them, so a clear sky or low rain can't lift the period.
Greyed factors are scored normally — extreme heat overrides them, so a clear sky or low rain can't lift the period.
Greyed factors are scored normally — extreme heat overrides them, so a clear sky or low rain can't lift the period.
Greyed factors are scored normally — extreme heat overrides them, so a clear sky or low rain can't lift the period.
Greyed factors are scored normally — extreme heat overrides them, so a clear sky or low rain can't lift the period.
Greyed factors are scored normally — extreme heat overrides them, so a clear sky or low rain can't lift the period.
Greyed factors are scored normally — extreme heat overrides them, so a clear sky or low rain can't lift the period.
Greyed factors are scored normally — extreme heat overrides them, so a clear sky or low rain can't lift the period.
Greyed factors are scored normally — extreme heat overrides them, so a clear sky or low rain can't lift the period.
Greyed factors are scored normally — extreme heat overrides them, so a clear sky or low rain can't lift the period.
Greyed factors are scored normally — extreme heat overrides them, so a clear sky or low rain can't lift the period.
Greyed factors are scored normally — extreme heat overrides them, so a clear sky or low rain can't lift the period.
Greyed factors are scored normally — extreme heat overrides them, so a clear sky or low rain can't lift the period.
Greyed factors are scored normally — extreme heat overrides them, so a clear sky or low rain can't lift the period.
Greyed factors are scored normally — extreme heat overrides them, so a clear sky or low rain can't lift the period.
Greyed factors are scored normally — extreme heat overrides them, so a clear sky or low rain can't lift the period.
How is this scored? HCI / Steadman / CCI gate — full methodology and citations below.
Compare with another destination
Add as many as you like — stacked below the main strips above. Each row is just the recent-window score strip and (for beach destinations) sea-temperature strip.
Visit November through March, when daytime temperatures sit in the low-to-mid 20s and the desert is genuinely pleasant. February and March are the sweet spot — warm enough for the beach, cool enough for desert excursions. June through September is unsuitable for outdoor tourism: 40°C+ daily, heavy humidity off the Gulf, and most outdoor activities effectively shut down.
Tours in Dubai
26 top-rated tours via Viator. Booking links earn this site a commission at no cost to you. Map locations are approximate (centred on Dubai).
- 1
 Dubai: Half-Day Desert Safari, Camels, Quad Bike & Refreshments
 - 2
 Dubai Premium Red Dunes Safari, Camels & 5* BBQ at Al Khayma Camp
 - 3
 Private Abu Dhabi City Tour From Dubai
 - 4
 Full Day Dubai City Tour with At the Top Burj Khalifa Ticket
 - 5
 Dubai Private Layover Tour with Round-Trip Airport Transfers
 - 6
 Private Dubai Desert Safari: BBQ Dinner, Sandboarding & 5 Shows
 - 7
 Private Morning Desert Safari Dubai with Dune Bashing & Sandboard
 - 8
 Dubai Desert Safari Dune Bashing, 60min ATV Quad, Camel Ride, BBQ
 - 9
 Dubai Red Dunes ATV, Camels, Stargazing & 5* BBQ Al Khayma Camp
 - 10
 Dubai Overnight Desert Safari, BBQ & Stargazing at Al Khayma Camp
 - 11
 Dubai To Abu Dhabi: Grand Mosque, Royal Palace & Etihad Tower
 - 12
 Abu Dhabi Premium Full-Day Sightseeing Tour From Dubai
 - 13
 Dubai Desert Safari, Dune Bashing, Camel Ride, Sandboarding & BBQ
 - 14
 Dubai Dune Buggy Safari Tour in Red Dunes Options
 - 15
 Dubai Morning Buggy Dunes Safari with Sandboarding & Camel Ride
 - 16
 Dubai Aladdin Tour: Souks, Creek, Old Dubai and Tastings
 - 17
 Dubai: Luxury Superyacht with Live DJ, Swimming & Open Bar
 - 18
 Dubai: 30min Jet Ski: Burj Al Arab w Pics, Videos, free Ice Cream
 - 19
 Dubai: Heritage Desert Safari in Vintage Land Rover with Dinner
 - 20
 Dubai Morning Desert Safari with Quad Biking & More Activities
 - 21
 Fastest Jet Ski with Dubai Skyline, Burj Al Arab Views and Juice
 - 22
 Dubai Red Dunes Desert Safari, Quad Bike, Camels at Al Khayma
 - 23
 Dubai Harbor: Luxury Yacht Tour with BBQ Options
 - 24
 From Dubai: Abu Dhabi Sheikh Zayed Grand Mosque Guided Tour
 - 25
 Dubai Desert Safari: Luxury Fortress Dinner, Dune Bash, Quad Bike
 - 26
 Desert Safari with Quad Bike, BBQ at Premium Camp & Camel Ride
Last refreshed 2026-05-25.
Similar climatesSur93% · Jeddah93% · Eilat89%
Other destinations with the most-alike year-round climate to Dubai (apparent temperature, rain hours, sunshine — matched within the same trip-profile). The ±N chip compares each match's typical score for the current month against Dubai's. Based on the 2020-2024 climatology, not this year's actual weather.
Month-by-month
| Month | Temp °C | Feels °C | Rain days | Rain h | Rain h/day | Humidity | Wind km/h | Sun h | UV | Interest | Score |
|---|---|---|---|---|---|---|---|---|---|---|---|
| Jan | 15–24 | 22 | 4 | 38 | 9.5 | 52% | 22 | 224 | 5 | Quiet | 10 |
| Feb | 17–25 | 24 | 1 | 11 | 11.0 | 52% | 23 | 221 | 6 | Quiet | 10 |
| Mar | 19–29 | 28 | 1 | 13 | 13.0 | 46% | 25 | 242 | 8 | Quiet | 10 |
| Apr | 22–32 | 32 | 1 | 10 | 10.0 | 41% | 24 | 245 | 9 | Quiet | 7 |
| May | 25–36 | 37 | 0 | 2 | — | 39% | 25 | 279 | 10 | Quiet | 4 |
| Jun | 29–39 | 42 | 0 | 0 | — | 40% | 24 | 275 | 10 | Quiet | 2 |
| Jul | 31–41 | 44 | 1 | 4 | 4.0 | 41% | 25 | 260 | 9 | Quiet | 2 |
| Aug | 31–41 | 44 | 0 | 0 | — | 40% | 25 | 259 | 9 | Busy | 2 |
| Sep | 28–39 | 42 | 0 | 0 | — | 40% | 24 | 255 | 8 | Busy | 2 |
| Oct | 25–35 | 37 | 0 | 1 | — | 43% | 22 | 246 | 7 | Moderate | 4 |
| Nov | 22–31 | 31 | 1 | 5 | 5.0 | 46% | 20 | 223 | 5 | Peak | 7 |
| Dec | 18–27 | 26 | 1 | 11 | 11.0 | 47% | 19 | 225 | 4 | Busy | 10 |
UV Index in Dubai by Month
UV index in Dubai peaks at 10 (very high) in May, dropping to 4 (moderate) in December. April, May, June, July, August, September reach very high or extreme levels — apply SPF 50+, wear a hat and protective clothing, and limit direct sun between 11:00 and 17:00.
Best months in detail
January
10/1015–24°C (feels 22°C) · 4 rain days (38h) · 224 sun hours · 52% humidity · Quiet crowd · UV 5 (moderate)
February
10/1017–25°C (feels 24°C) · 1 rain days (11h) · 221 sun hours · 52% humidity · Quiet crowd · UV 6 (high)
December
10/1018–27°C · 1 rain days (11h) · 225 sun hours · 47% humidity · Busy crowd · UV 4 (moderate)
Every month
Show the other 9 months in detail
March
10/1019–29°C · 1 rain days (13h) · 242 sun hours · 46% humidity · Quiet crowd · UV 8 (high) · sunniest 1 in 10 days reach 9 (very high)
April
7/1022–32°C · 1 rain days (10h) · 245 sun hours · 41% humidity · Quiet crowd · UV 9 (very high)
May
4/1025–36°C · 0 rain days (2h) · 279 sun hours · 39% humidity · Quiet crowd · UV 10 (very high) · sunniest 1 in 10 days reach 11 (extreme)
June
2/1029–39°C (feels 42°C) · 0 rain days (0h) · 275 sun hours · 40% humidity · Quiet crowd · UV 10 (very high)
July
2/1031–41°C (feels 44°C) · 1 rain days (4h) · 260 sun hours · 41% humidity · Quiet crowd · UV 9 (very high)
August
2/1031–41°C (feels 44°C) · 0 rain days (0h) · 259 sun hours · 40% humidity · Busy crowd · UV 9 (very high)
September
2/1028–39°C (feels 42°C) · 0 rain days (0h) · 255 sun hours · 40% humidity · Busy crowd · UV 8 (very high)
October
4/1025–35°C (feels 37°C) · 0 rain days (1h) · 246 sun hours · 43% humidity · Moderate crowd · UV 7 (high) · sunniest 1 in 10 days reach 8 (very high)
November
7/1022–31°C · 1 rain days (5h) · 223 sun hours · 46% humidity · Peak crowd · UV 5 (moderate) · sunniest 1 in 10 days reach 6 (high)
Comparisons people search for
Pairs validated by Google Autocomplete demand — only pairs people actually compare.
Frequently asked questions about visiting Dubai
When is the best time to visit Dubai?
January is the highest-scoring month (10/10 on the Holiday Climate Index). Typical conditions: 15–24°C (4 rainy days). The top three months by score are January, February, December.
What is the worst time to visit Dubai?
September is the lowest-scoring month (2/10, capped by extreme heat). Typical conditions: 28–39°C (0 rainy days).
Is Dubai too hot in summer?
8 months (April, May, June, July, August, September, October, November) trip the heat deal-breaker in our scoring: apparent temperature crosses the comfort cap, so even with clear skies and low rain the score is held down. Plan around it if heat tolerance is low.
When are crowds lowest in Dubai?
Search-interest seasonality (Google Trends 2021-2025) is lowest in March and peaks in November. Interest tracks both in-trip visitors and lead-time planners, so treat it as a "destination is on people's minds" signal rather than literal arrivals.
Which months in Dubai have good weather but fewer tourists?
January (climate 10/10, crowd index 26) and February (climate 10/10, crowd index 9) — shoulder months with above-average climate and below-median search-interest. Often the best value-for-weather trade.
What is the UV index in Dubai by month?
UV peaks at 10 (very high) in May and is lowest in December at 4 (moderate). Monthly peak values: Jan 5, Feb 6, Mar 8, Apr 9, May 10, Jun 10, Jul 9, Aug 9, Sep 8, Oct 7, Nov 5, Dec 4. April, May, June, July, August, September reach very high or extreme levels — apply SPF 50+, wear a hat and protective clothing, and limit direct sun between 11:00 and 17:00.
What is the UV index in Dubai in May?
May is the peak UV month in Dubai, with a daily-peak UV index of 10 (very high). At this level, sunburn can occur in under 20 minutes on unprotected fair skin. Apply SPF 50+, wear protective clothing and a hat, and avoid direct midday sun (11:00–17:00).
How high can UV get in Dubai on the sunniest days?
Most days look like the monthly average, but on the sunniest ~1 in 10 days UV climbs higher than the mean suggests. May is the worst case: typical days average UV 10 (very high), but the top 10% of days reach UV 11 (extreme) — and even higher. Months where the sunniest days routinely exceed the typical reading: March, May, October, November. Plan sun protection for the worst case, not the average.
Is air quality in Dubai bad for travelers?
PM2.5 (fine-particle pollution) exceeds the WHO sensitive-group guideline (15 µg/m³) in 12 months: January, February, March, April, May, June, July, August, September, October, November, December. The worst month is August with a typical-day mean of 59 µg/m³ (hazardous); on the worst 10% of days PM2.5 reaches 74 µg/m³ (hazardous) and higher. People with asthma, heart conditions, or sensitive children may want to avoid these months or limit outdoor activity. Source: CAMS via Open-Meteo.