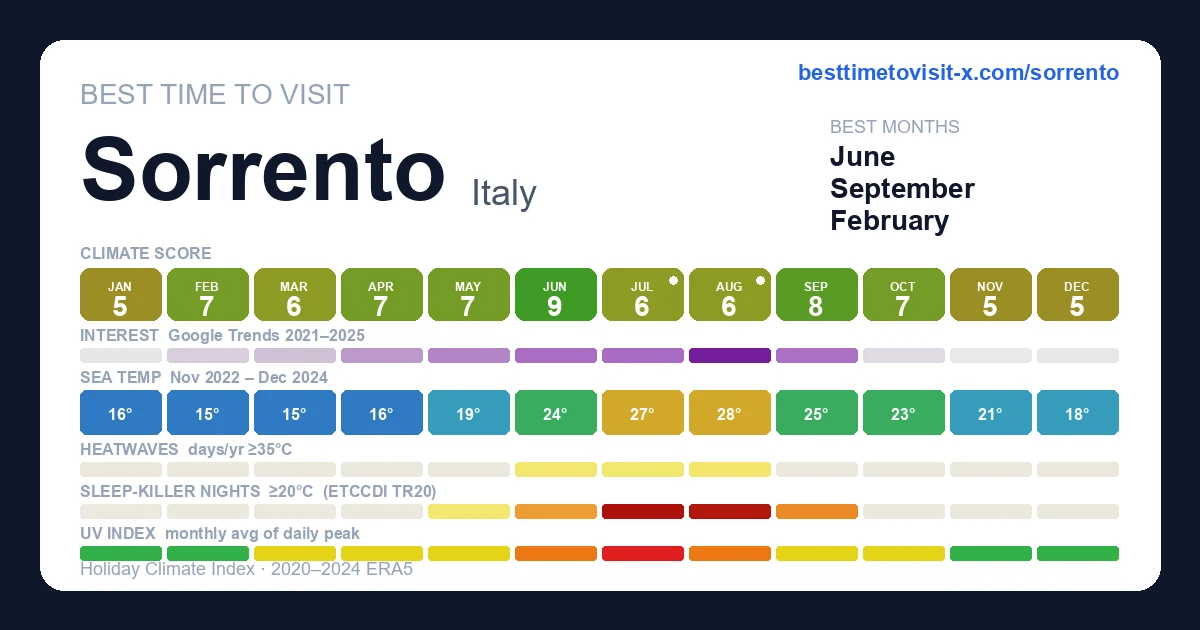
Best time to visit Sorrento
Re-score for me — drag the dial — every chart recolours live for your heat & sea limits 27°C · sea 29°C
Default 27 °C is the upper edge of the Holiday Climate Index "ideal comfort" band (Scott, Rutty, Amelung & Tang, 2016). Above this, most warm-tourism travellers report measurable discomfort.
Default 29 °C is the Beach Climate Index "bathtub" line (Morgan et al.) — where the sea stops being refreshing and starts feeling like a warm bath.
Greyed factors are scored normally — extreme heat overrides them, so a clear sky or low rain can't lift the period.
Greyed factors are scored normally — extreme heat overrides them, so a clear sky or low rain can't lift the period.
Greyed factors are scored normally — extreme heat overrides them, so a clear sky or low rain can't lift the period.
Greyed factors are scored normally — extreme heat overrides them, so a clear sky or low rain can't lift the period.
Greyed factors are scored normally — extreme heat overrides them, so a clear sky or low rain can't lift the period.
Greyed factors are scored normally — extreme heat overrides them, so a clear sky or low rain can't lift the period.
Greyed factors are scored normally — extreme heat overrides them, so a clear sky or low rain can't lift the period.
Greyed factors are scored normally — extreme heat overrides them, so a clear sky or low rain can't lift the period.
Greyed factors are scored normally — extreme heat overrides them, so a clear sky or low rain can't lift the period.
Greyed factors are scored normally — extreme heat overrides them, so a clear sky or low rain can't lift the period.
Greyed factors are scored normally — extreme heat overrides them, so a clear sky or low rain can't lift the period.
Greyed factors are scored normally — extreme heat overrides them, so a clear sky or low rain can't lift the period.
Greyed factors are scored normally — extreme heat overrides them, so a clear sky or low rain can't lift the period.
Greyed factors are scored normally — extreme heat overrides them, so a clear sky or low rain can't lift the period.
How is this scored? HCI / Steadman / CCI gate — full methodology and citations below.
Compare with another destination
Add as many as you like — stacked below the main strips above. Each row is just the recent-window score strip and (for beach destinations) sea-temperature strip.
Tours in Sorrento
29 top-rated tours via Viator. Booking links earn this site a commission at no cost to you.
- 1
 Private Amalfi Coast Day Tour from Sorrento or Naples
 - 2
 Private Boat Tour to Capri or Amalfi Coast from Sorrento-Positano
 - 3
 Day Trip to Positano, Amalfi & Ravello from Sorrento
 - 4
 Priority Access Pompeii & Vesuvius Full-Day Tour from Sorrento
 - 5
 Skip-the-Line Pompeii Guided Tour from Sorrento
 - 6
 Full Day Private Amalfi Coast Tour from Sorrento or Naples
 - 7
 Private Capri Boat Tour "Local Gems & Prosecco" Best Seller
 - 8
 Authentic cooking class on a farm with a view of Sorrento.
 - 9
 Capri Daily Shared Boat Tour from Sorrento and Positano
 - 10
 Capri Small-Group Boat Day Tour from Sorrento
 - 11
 Positano Amalfi and Ravello Small Group Tour from Sorrento
 - 12
 Path of the Gods Hiking Day Tour from Sorrento
 - 13
 Blue Grotto, Capri & Anacapri Guided Full-Day Tour from Sorrento
 - 14
 Capri & Blue Grotto Semi Private Boat Day Trip from Sorrento
 - 15
 Amalfi Coast & Positano: Boat Tour with Snorkeling & Drinks
 - 16
 Positano & Amalfi Coast Small-Group Boat Day Tour from Sorrento
 - 17
 Sorrento Farm and Food Experience including Olive Oil, Limoncello, Wine tasting
 - 18
 Full-Day Amalfi Coast Experience from Sorrento, Naples or Salerno
 - 19
 Sorrento: Cook Like a Local with a Stunning Sea View
 - 20
 Sorrento: Capri Small-Group Boat Tour with Swim & 4 hour ashore
 - 21
 Pizza School with Wine and Limoncello Tasting in a Local Farm
 - 22
 Capri Boat Tour from Sorrento: Swim, Grottos & Light Lunch
 - 23
 Capri Boat Tour with Optional Blue Grotto Visit from Sorrento
 - 24
 Authentic Farm Tour with Pizza, Cheese, Wine & Limoncello Tasting
 - 25
 Sorrento Farm by Tuk Tuk: Cheese, Limoncello & Hands-On Pizza
 - 26
 Capri Deluxe/First to Blue Grotto/from Sorrento Positano & Amalfi
 - 27
 Pompeii Express Guided Tour by Train from Sorrento
 - 28
 Tasting of 5 Wines with Typical Products in Sorrento
 - 29
 The Three Tenors in Sorrento
Last refreshed 2026-05-25.
Similar climatesPositano99% · Amalfi98% · Salerno97%
Other destinations with the most-alike year-round climate to Sorrento (apparent temperature, rain hours, sunshine — matched within the same trip-profile). The ±N chip compares each match's typical score for the current month against Sorrento's. Based on the 2020-2024 climatology, not this year's actual weather.
Month-by-month
| Month | Temp °C | Feels °C | Rain days | Rain h | Rain h/day | Humidity | Wind km/h | Sun h | UV | Interest | Score |
|---|---|---|---|---|---|---|---|---|---|---|---|
| Jan | 7–13 | 11 | 14 | 208 | 14.9 | 73% | 14 | 164 | 1 | Quiet | 5 |
| Feb | 8–14 | 12 | 9 | 124 | 13.8 | 69% | 14 | 186 | 2 | Quiet | 7 |
| Mar | 8–15 | 13 | 12 | 162 | 13.5 | 67% | 14 | 225 | 4 | Quiet | 6 |
| Apr | 10–17 | 16 | 11 | 136 | 12.4 | 65% | 13 | 238 | 5 | Moderate | 7 |
| May | 15–22 | 22 | 12 | 137 | 11.4 | 66% | 12 | 265 | 6 | Moderate | 7 |
| Jun | 19–27 | 28 | 6 | 67 | 11.2 | 60% | 11 | 294 | 8 | Moderate | 9 |
| Jul | 23–30 | 33 | 3 | 33 | 11.0 | 55% | 12 | 322 | 8 | Moderate | 6 |
| Aug | 23–30 | 33 | 8 | 64 | 8.0 | 56% | 12 | 296 | 7 | Peak | 6 |
| Sep | 20–26 | 28 | 9 | 121 | 13.4 | 60% | 13 | 243 | 5 | Moderate | 8 |
| Oct | 16–22 | 23 | 10 | 136 | 13.6 | 71% | 12 | 212 | 4 | Quiet | 7 |
| Nov | 12–18 | 17 | 16 | 216 | 13.5 | 74% | 14 | 159 | 2 | Quiet | 5 |
| Dec | 9–15 | 13 | 15 | 218 | 14.5 | 76% | 15 | 151 | 1 | Quiet | 5 |
UV Index in Sorrento by Month
UV index in Sorrento peaks at 8 (very high) in July, dropping to 1 (low) in January. July reach very high or extreme levels — apply SPF 50+, wear a hat and protective clothing, and limit direct sun between 11:00 and 17:00.
Best months in detail
June
9/1019–27°C (feels 28°C) · 6 rain days (67h) · 294 sun hours · 60% humidity · Moderate crowd · UV 8 (high) · sunniest 1 in 10 days reach 9 (very high)
September
8/1020–26°C (feels 28°C) · 9 rain days (121h) · 243 sun hours · 60% humidity · Moderate crowd · UV 5 (moderate) · sunniest 1 in 10 days reach 7 (high)
May
7/1015–22°C · 12 rain days (137h) · 265 sun hours · 66% humidity · Moderate crowd · UV 6 (moderate) · sunniest 1 in 10 days reach 7 (high)
Every month
Show the other 9 months in detail
January
5/107–13°C (feels 11°C) · 14 rain days (208h) · 164 sun hours · 73% humidity · Quiet crowd · UV 1 (low)
February
7/108–14°C (feels 12°C) · 9 rain days (124h) · 186 sun hours · 69% humidity · Quiet crowd · UV 2 (low) · sunniest 1 in 10 days reach 3 (moderate)
March
6/108–15°C (feels 13°C) · 12 rain days (162h) · 225 sun hours · 67% humidity · Quiet crowd · UV 4 (moderate)
April
7/1010–17°C (feels 16°C) · 11 rain days (136h) · 238 sun hours · 65% humidity · Moderate crowd · UV 5 (moderate) · sunniest 1 in 10 days reach 7 (high)
July
6/1023–30°C (feels 33°C) · 3 rain days (33h) · 322 sun hours · 55% humidity · Moderate crowd · UV 8 (very high)
August
6/1023–30°C (feels 33°C) · 8 rain days (64h) · 296 sun hours · 56% humidity · Peak crowd · UV 7 (high) · sunniest 1 in 10 days reach 8 (very high)
October
7/1016–22°C · 10 rain days (136h) · 212 sun hours · 71% humidity · Quiet crowd · UV 4 (moderate)
November
5/1012–18°C · 16 rain days (216h) · 159 sun hours · 74% humidity · Quiet crowd · UV 2 (low)
December
5/109–15°C (feels 13°C) · 15 rain days (218h) · 151 sun hours · 76% humidity · Quiet crowd · UV 1 (low)
Comparisons people search for
Pairs validated by Google Autocomplete demand — only pairs people actually compare.
Frequently asked questions about visiting Sorrento
When is the best time to visit Sorrento?
June is the highest-scoring month (9/10 on the Holiday Climate Index). Typical conditions: 19–27°C (6 rainy days). The top three months by score are June, September, May.
What is the worst time to visit Sorrento?
December is the lowest-scoring month (5/10). Typical conditions: 9–15°C (15 rainy days).
Is Sorrento too hot in summer?
2 months (July, August) trip the heat deal-breaker in our scoring: apparent temperature crosses the comfort cap, so even with clear skies and low rain the score is held down. Plan around it if heat tolerance is low.
When are crowds lowest in Sorrento?
Search-interest seasonality (Google Trends 2021-2025) is lowest in November and peaks in August. Interest tracks both in-trip visitors and lead-time planners, so treat it as a "destination is on people's minds" signal rather than literal arrivals.
Which months in Sorrento have good weather but fewer tourists?
February (climate 7/10, crowd index 15) and April (climate 7/10, crowd index 40) — shoulder months with above-average climate and below-median search-interest. Often the best value-for-weather trade.
What is the UV index in Sorrento by month?
UV peaks at 8 (very high) in July and is lowest in January at 1 (low). Monthly peak values: Jan 1, Feb 2, Mar 4, Apr 5, May 6, Jun 8, Jul 8, Aug 7, Sep 5, Oct 4, Nov 2, Dec 1. July reach very high or extreme levels — apply SPF 50+, wear a hat and protective clothing, and limit direct sun between 11:00 and 17:00.
What is the UV index in Sorrento in July?
July is the peak UV month in Sorrento, with a daily-peak UV index of 8 (very high). At this level, sunburn can occur in under 20 minutes on unprotected fair skin. Apply SPF 50+, wear protective clothing and a hat, and avoid direct midday sun (11:00–17:00).
How high can UV get in Sorrento on the sunniest days?
Most days look like the monthly average, but on the sunniest ~1 in 10 days UV climbs higher than the mean suggests. June is the worst case: typical days average UV 8 (high), but the top 10% of days reach UV 9 (very high) — and even higher. Months where the sunniest days routinely exceed the typical reading: February, April, May, June, August, September. Plan sun protection for the worst case, not the average.
Is air quality in Sorrento bad for travelers?
PM2.5 (fine-particle pollution) exceeds the WHO sensitive-group guideline (15 µg/m³) in 9 months: January, February, March, April, June, July, August, October, December. The worst month is February with a typical-day mean of 11 µg/m³ (moderate); on the worst 10% of days PM2.5 reaches 18 µg/m³ (unhealthy for sensitive) and higher. People with asthma, heart conditions, or sensitive children may want to avoid these months or limit outdoor activity. Source: CAMS via Open-Meteo.