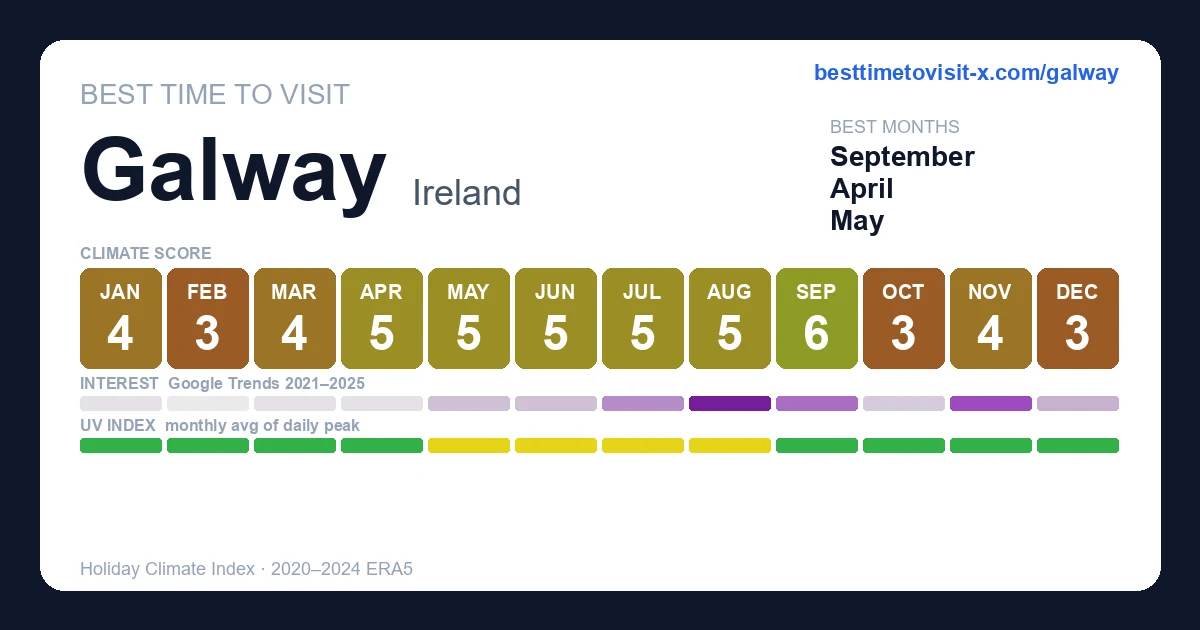
January 4/10
feels 5°C
(+1°C vs 1991-2020) · HCI 35/100
Day 8° · Night 4°
83% humidity 25 km/h wind 14 rain days (187h) 86h sun
Thermal 1
Sky 4
Rain 5
Wind 9
Higher = better, including rain & wind (green = "doesn't hurt the score", not "lots of it").
February 3/10
feels 5°C
· HCI 26/100
Day 9° · Night 5°
78% humidity 30 km/h wind 19 rain days (255h) 93h sun
Thermal 1
Sky 3
Rain 2
Wind 9
Higher = better, including rain & wind (green = "doesn't hurt the score", not "lots of it").
March 4/10
feels 7°C
(+1°C vs 1991-2020) · HCI 35/100
Day 11° · Night 5°
75% humidity 25 km/h wind 16 rain days (226h) 133h sun
Thermal 2
Sky 4
Rain 3
Wind 9
Higher = better, including rain & wind (green = "doesn't hurt the score", not "lots of it").
April 5/10
feels 10°C
(+1°C vs 1991-2020) · HCI 50/100
Day 13° · Night 6°
68% humidity 21 km/h wind 13 rain days (177h) 190h sun
Thermal 4
Sky 6
Rain 5
Wind 10
Higher = better, including rain & wind (green = "doesn't hurt the score", not "lots of it").
May 5/10
feels 13°C
(+1°C vs 1991-2020) · HCI 52/100
Day 16° · Night 9°
67% humidity 21 km/h wind 15 rain days (200h) 237h sun
Thermal 5
Sky 5
Rain 4
Wind 10
Higher = better, including rain & wind (green = "doesn't hurt the score", not "lots of it").
June 5/10
feels 15°C
· HCI 51/100
Day 17° · Night 11°
69% humidity 21 km/h wind 17 rain days (226h) 203h sun
Thermal 6
Sky 4
Rain 3
Wind 10
Higher = better, including rain & wind (green = "doesn't hurt the score", not "lots of it").
July 5/10
feels 17°C
· HCI 47/100
Day 19° · Night 13°
73% humidity 19 km/h wind 18 rain days (259h) 203h sun
Thermal 6
Sky 3
Rain 2
Wind 10
Higher = better, including rain & wind (green = "doesn't hurt the score", not "lots of it").
August 5/10
feels 17°C
(+1°C vs 1991-2020) · HCI 47/100
Day 19° · Night 13°
73% humidity 22 km/h wind 18 rain days (264h) 209h sun
Thermal 6
Sky 3
Rain 2
Wind 10
Higher = better, including rain & wind (green = "doesn't hurt the score", not "lots of it").
September 6/10
feels 16°C
(+2°C vs 1991-2020) · HCI 56/100
Day 17° · Night 11°
75% humidity 21 km/h wind 15 rain days (185h) 159h sun
Thermal 6
Sky 6
Rain 4
Wind 10
Higher = better, including rain & wind (green = "doesn't hurt the score", not "lots of it").
October 3/10
feels 11°C
· HCI 33/100
Day 14° · Night 9°
79% humidity 24 km/h wind 20 rain days (270h) 130h sun
Thermal 4
Sky 2
Rain 2
Wind 9
Higher = better, including rain & wind (green = "doesn't hurt the score", not "lots of it").
November 4/10
feels 8°C
(+1°C vs 1991-2020) · HCI 37/100
Day 11° · Night 7°
83% humidity 25 km/h wind 17 rain days (209h) 88h sun
Thermal 2
Sky 4
Rain 4
Wind 9
Higher = better, including rain & wind (green = "doesn't hurt the score", not "lots of it").
December 3/10
feels 5°C
· HCI 30/100
Day 9° · Night 5°
85% humidity 26 km/h wind 17 rain days (220h) 73h sun
Thermal 1
Sky 3
Rain 3
Wind 9
Higher = better, including rain & wind (green = "doesn't hurt the score", not "lots of it").
January 1–10 3/10
feels 4°C
· HCI 35/100
Day 8° · Night 4°
84% humidity 26 km/h wind 5 rain days (59h) 30h sun
Thermal 1
Sky 4
Rain 5
Wind 9
Higher = better, including rain & wind (green = "doesn't hurt the score", not "lots of it").
January 11–20 4/10
feels 4°C
· HCI 36/100
Day 8° · Night 3°
83% humidity 23 km/h wind 4 rain days (63h) 30h sun
Thermal 1
Sky 4
Rain 5
Wind 9
Higher = better, including rain & wind (green = "doesn't hurt the score", not "lots of it").
January 21–31 3/10
feels 5°C
(+1°C vs 1991-2020) · HCI 34/100
Day 9° · Night 5°
83% humidity 25 km/h wind 5 rain days (65h) 26h sun
Thermal 1
Sky 4
Rain 4
Wind 9
Higher = better, including rain & wind (green = "doesn't hurt the score", not "lots of it").
February 1–10 3/10
feels 5°C
(+1°C vs 1991-2020) · HCI 30/100
Day 9° · Night 5°
81% humidity 28 km/h wind 5 rain days (79h) 23h sun
Thermal 1
Sky 3
Rain 3
Wind 9
Higher = better, including rain & wind (green = "doesn't hurt the score", not "lots of it").
February 11–20 1/10
feels 5°C
· HCI 13/100
Day 10° · Night 6°
80% humidity 34 km/h wind 9 rain days (110h) 34h sun
Thermal 1
Sky 0
Rain 0
Wind 8
Higher = better, including rain & wind (green = "doesn't hurt the score", not "lots of it").
February 21–28 3/10
feels 5°C
· HCI 35/100
Day 9° · Night 5°
74% humidity 29 km/h wind 6 rain days (66h) 36h sun
Thermal 1
Sky 5
Rain 4
Wind 9
Higher = better, including rain & wind (green = "doesn't hurt the score", not "lots of it").
March 1–10 4/10
feels 5°C
· HCI 42/100
Day 9° · Night 3°
74% humidity 24 km/h wind 4 rain days (52h) 40h sun
Thermal 1
Sky 6
Rain 6
Wind 9
Higher = better, including rain & wind (green = "doesn't hurt the score", not "lots of it").
March 11–20 3/10
feels 7°C
· HCI 27/100
Day 11° · Night 5°
77% humidity 27 km/h wind 7 rain days (88h) 37h sun
Thermal 2
Sky 3
Rain 2
Wind 9
Higher = better, including rain & wind (green = "doesn't hurt the score", not "lots of it").
March 21–31 3/10
feels 8°C
(+1°C vs 1991-2020) · HCI 33/100
Day 12° · Night 6°
74% humidity 24 km/h wind 6 rain days (85h) 56h sun
Thermal 3
Sky 3
Rain 2
Wind 9
Higher = better, including rain & wind (green = "doesn't hurt the score", not "lots of it").
April 1–10 4/10
feels 8°C
· HCI 43/100
Day 12° · Night 5°
70% humidity 25 km/h wind 5 rain days (65h) 54h sun
Thermal 3
Sky 5
Rain 4
Wind 9
Higher = better, including rain & wind (green = "doesn't hurt the score", not "lots of it").
April 11–20 5/10
feels 10°C
(+1°C vs 1991-2020) · HCI 47/100
Day 13° · Night 6°
71% humidity 21 km/h wind 5 rain days (64h) 55h sun
Thermal 3
Sky 5
Rain 4
Wind 10
Higher = better, including rain & wind (green = "doesn't hurt the score", not "lots of it").
April 21–30 6/10
feels 12°C
(+2°C vs 1991-2020) · HCI 62/100
Day 14° · Night 6°
64% humidity 18 km/h wind 3 rain days (48h) 80h sun
Thermal 5
Sky 7
Rain 7
Wind 10
Higher = better, including rain & wind (green = "doesn't hurt the score", not "lots of it").
May 1–10 5/10
feels 12°C
(+1°C vs 1991-2020) · HCI 46/100
Day 15° · Night 8°
70% humidity 21 km/h wind 6 rain days (72h) 65h sun
Thermal 4
Sky 4
Rain 3
Wind 10
Higher = better, including rain & wind (green = "doesn't hurt the score", not "lots of it").
May 11–20 5/10
feels 13°C
(+1°C vs 1991-2020) · HCI 54/100
Day 16° · Night 9°
68% humidity 21 km/h wind 5 rain days (63h) 79h sun
Thermal 5
Sky 5
Rain 4
Wind 10
Higher = better, including rain & wind (green = "doesn't hurt the score", not "lots of it").
May 21–31 6/10
feels 14°C
· HCI 57/100
Day 17° · Night 9°
64% humidity 22 km/h wind 4 rain days (65h) 93h sun
Thermal 6
Sky 5
Rain 5
Wind 10
Higher = better, including rain & wind (green = "doesn't hurt the score", not "lots of it").
June 1–10 6/10
feels 15°C
· HCI 57/100
Day 17° · Night 10°
66% humidity 21 km/h wind 5 rain days (65h) 74h sun
Thermal 6
Sky 5
Rain 4
Wind 10
Higher = better, including rain & wind (green = "doesn't hurt the score", not "lots of it").
June 11–20 6/10
feels 16°C
(+2°C vs 1991-2020) · HCI 58/100
Day 18° · Night 11°
70% humidity 20 km/h wind 5 rain days (63h) 71h sun
Thermal 6
Sky 5
Rain 4
Wind 10
Higher = better, including rain & wind (green = "doesn't hurt the score", not "lots of it").
June 21–30 4/10
feels 15°C
(−1°C vs 1991-2020) · HCI 37/100
Day 17° · Night 12°
73% humidity 23 km/h wind 7 rain days (98h) 59h sun
Thermal 6
Sky 1
Rain 1
Wind 9
Higher = better, including rain & wind (green = "doesn't hurt the score", not "lots of it").
July 1–10 4/10
feels 16°C
· HCI 43/100
Day 17° · Night 12°
72% humidity 21 km/h wind 6 rain days (91h) 69h sun
Thermal 6
Sky 2
Rain 2
Wind 10
Higher = better, including rain & wind (green = "doesn't hurt the score", not "lots of it").
July 11–20 6/10
feels 19°C
(+2°C vs 1991-2020) · HCI 63/100
Day 19° · Night 13°
72% humidity 18 km/h wind 4 rain days (64h) 72h sun
Thermal 7
Sky 5
Rain 5
Wind 10
Higher = better, including rain & wind (green = "doesn't hurt the score", not "lots of it").
July 21–31 4/10
feels 18°C
(+1°C vs 1991-2020) · HCI 38/100
Day 19° · Night 13°
74% humidity 20 km/h wind 8 rain days (103h) 63h sun
Thermal 6
Sky 1
Rain 0
Wind 10
Higher = better, including rain & wind (green = "doesn't hurt the score", not "lots of it").
August 1–10 5/10
feels 17°C
· HCI 46/100
Day 18° · Night 13°
74% humidity 22 km/h wind 6 rain days (88h) 67h sun
Thermal 6
Sky 3
Rain 2
Wind 10
Higher = better, including rain & wind (green = "doesn't hurt the score", not "lots of it").
August 11–20 4/10
feels 18°C
(+1°C vs 1991-2020) · HCI 45/100
Day 19° · Night 14°
74% humidity 23 km/h wind 6 rain days (94h) 66h sun
Thermal 7
Sky 2
Rain 2
Wind 9
Higher = better, including rain & wind (green = "doesn't hurt the score", not "lots of it").
August 21–31 5/10
feels 17°C
(+1°C vs 1991-2020) · HCI 48/100
Day 18° · Night 13°
73% humidity 21 km/h wind 6 rain days (83h) 76h sun
Thermal 6
Sky 3
Rain 2
Wind 10
Higher = better, including rain & wind (green = "doesn't hurt the score", not "lots of it").
September 1–10 6/10
feels 19°C
(+3°C vs 1991-2020) · HCI 64/100
Day 19° · Night 13°
75% humidity 19 km/h wind 5 rain days (56h) 61h sun
Thermal 7
Sky 6
Rain 5
Wind 10
Higher = better, including rain & wind (green = "doesn't hurt the score", not "lots of it").
September 11–20 6/10
feels 16°C
(+2°C vs 1991-2020) · HCI 60/100
Day 17° · Night 11°
75% humidity 19 km/h wind 4 rain days (58h) 53h sun
Thermal 6
Sky 6
Rain 5
Wind 10
Higher = better, including rain & wind (green = "doesn't hurt the score", not "lots of it").
September 21–30 5/10
feels 13°C
(−1°C vs 1991-2020) · HCI 45/100
Day 15° · Night 10°
75% humidity 25 km/h wind 6 rain days (71h) 45h sun
Thermal 4
Sky 5
Rain 3
Wind 9
Higher = better, including rain & wind (green = "doesn't hurt the score", not "lots of it").
October 1–10 4/10
feels 13°C
(+1°C vs 1991-2020) · HCI 36/100
Day 15° · Night 11°
77% humidity 24 km/h wind 6 rain days (91h) 48h sun
Thermal 4
Sky 2
Rain 2
Wind 9
Higher = better, including rain & wind (green = "doesn't hurt the score", not "lots of it").
October 11–20 4/10
feels 11°C
· HCI 45/100
Day 14° · Night 9°
78% humidity 23 km/h wind 6 rain days (66h) 40h sun
Thermal 4
Sky 5
Rain 4
Wind 9
Higher = better, including rain & wind (green = "doesn't hurt the score", not "lots of it").
October 21–31 2/10
feels 10°C
(+1°C vs 1991-2020) · HCI 22/100
Day 13° · Night 9°
81% humidity 25 km/h wind 8 rain days (113h) 42h sun
Thermal 3
Sky 0
Rain 0
Wind 9
Higher = better, including rain & wind (green = "doesn't hurt the score", not "lots of it").
November 1–10 4/10
feels 9°C
(+1°C vs 1991-2020) · HCI 44/100
Day 12° · Night 8°
81% humidity 23 km/h wind 5 rain days (63h) 36h sun
Thermal 3
Sky 5
Rain 4
Wind 9
Higher = better, including rain & wind (green = "doesn't hurt the score", not "lots of it").
November 11–20 3/10
feels 9°C
(+2°C vs 1991-2020) · HCI 28/100
Day 12° · Night 8°
85% humidity 26 km/h wind 7 rain days (88h) 23h sun
Thermal 2
Sky 3
Rain 2
Wind 9
Higher = better, including rain & wind (green = "doesn't hurt the score", not "lots of it").
November 21–30 4/10
feels 6°C
· HCI 38/100
Day 10° · Night 5°
83% humidity 24 km/h wind 5 rain days (57h) 28h sun
Thermal 1
Sky 4
Rain 5
Wind 9
Higher = better, including rain & wind (green = "doesn't hurt the score", not "lots of it").
December 1–10 4/10
feels 4°C
(−1°C vs 1991-2020) · HCI 38/100
Day 8° · Night 4°
84% humidity 25 km/h wind 4 rain days (50h) 30h sun
Thermal 1
Sky 4
Rain 6
Wind 9
Higher = better, including rain & wind (green = "doesn't hurt the score", not "lots of it").
December 11–20 3/10
feels 5°C
· HCI 31/100
Day 9° · Night 5°
87% humidity 25 km/h wind 5 rain days (70h) 20h sun
Thermal 1
Sky 3
Rain 4
Wind 9
Higher = better, including rain & wind (green = "doesn't hurt the score", not "lots of it").
December 21–31 2/10
feels 5°C
(+1°C vs 1991-2020) · HCI 17/100
Day 10° · Night 6°
85% humidity 29 km/h wind 8 rain days (99h) 23h sun
Thermal 1
Sky 1
Rain 0
Wind 9
Higher = better, including rain & wind (green = "doesn't hurt the score", not "lots of it").
 The Irish Dance Experience in Galway, Ireland
 Galway to Aran Islands Inisheer, Doolin, Cliffs of Moher Day Tour
 Galway to Aran Islands & Cliffs of Moher Day Tour & Cliffs Cruise
 Cliffs of Moher & the Burren Tour from Galway
 The Welcome to Galway Walking Tour
 12:00 Cliffs of Moher Tour
 Galway Food Tours
 Cliffs of Moher & Burren Day Tour with a 2 hour stop at Cliffs
 Caherconnell Fort & Sheepdog Demonstrations