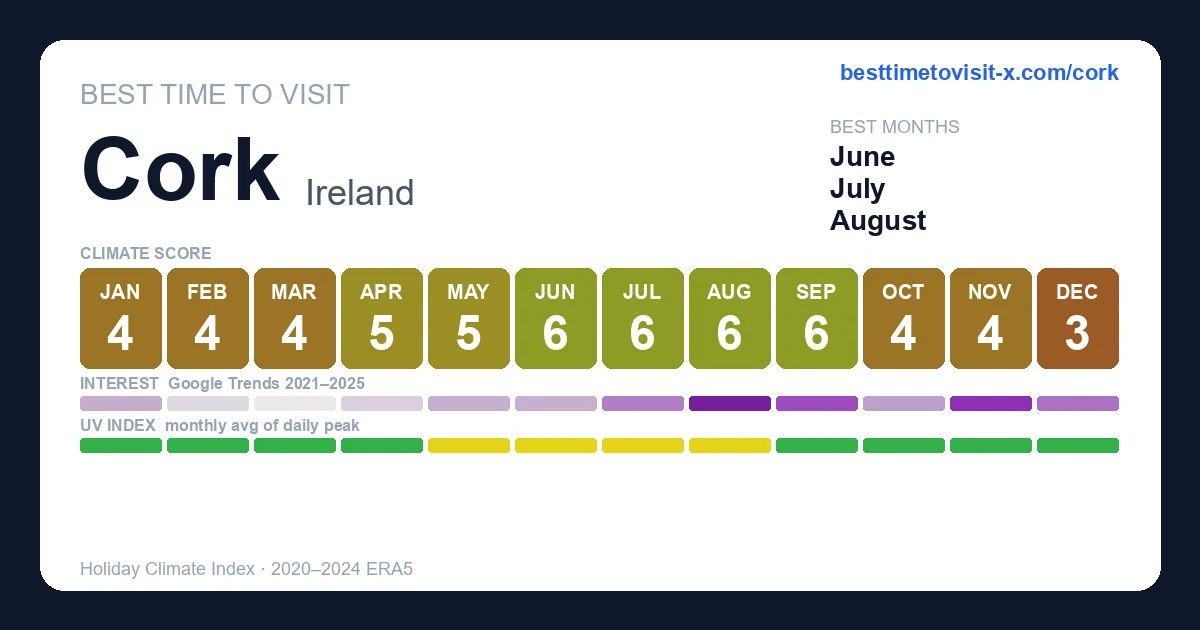
January 4/10
feels 5°C
· HCI 41/100
Day 8° · Night 3°
85% humidity 20 km/h wind 12 rain days (147h) 93h sun
Thermal 1
Sky 4
Rain 6
Wind 10
Higher = better, including rain & wind (green = "doesn't hurt the score", not "lots of it").
February 4/10
feels 6°C
(+1°C vs 1991-2020) · HCI 36/100
Day 10° · Night 5°
78% humidity 25 km/h wind 16 rain days (208h) 99h sun
Thermal 2
Sky 5
Rain 4
Wind 9
Higher = better, including rain & wind (green = "doesn't hurt the score", not "lots of it").
March 4/10
feels 7°C
· HCI 38/100
Day 11° · Night 4°
75% humidity 22 km/h wind 16 rain days (212h) 146h sun
Thermal 2
Sky 5
Rain 4
Wind 9
Higher = better, including rain & wind (green = "doesn't hurt the score", not "lots of it").
April 5/10
feels 10°C
(+1°C vs 1991-2020) · HCI 53/100
Day 12° · Night 6°
70% humidity 19 km/h wind 12 rain days (162h) 188h sun
Thermal 3
Sky 6
Rain 6
Wind 10
Higher = better, including rain & wind (green = "doesn't hurt the score", not "lots of it").
May 5/10
feels 13°C
(+1°C vs 1991-2020) · HCI 55/100
Day 15° · Night 8°
69% humidity 19 km/h wind 14 rain days (185h) 229h sun
Thermal 5
Sky 6
Rain 5
Wind 10
Higher = better, including rain & wind (green = "doesn't hurt the score", not "lots of it").
June 6/10
feels 16°C
· HCI 64/100
Day 18° · Night 11°
68% humidity 19 km/h wind 12 rain days (166h) 221h sun
Thermal 6
Sky 6
Rain 5
Wind 10
Higher = better, including rain & wind (green = "doesn't hurt the score", not "lots of it").
July 6/10
feels 18°C
· HCI 64/100
Day 19° · Night 12°
70% humidity 19 km/h wind 14 rain days (178h) 217h sun
Thermal 7
Sky 6
Rain 5
Wind 10
Higher = better, including rain & wind (green = "doesn't hurt the score", not "lots of it").
August 6/10
feels 18°C
(+1°C vs 1991-2020) · HCI 61/100
Day 19° · Night 12°
70% humidity 19 km/h wind 15 rain days (195h) 212h sun
Thermal 7
Sky 5
Rain 4
Wind 10
Higher = better, including rain & wind (green = "doesn't hurt the score", not "lots of it").
September 6/10
feels 16°C
(+1°C vs 1991-2020) · HCI 63/100
Day 17° · Night 11°
75% humidity 19 km/h wind 12 rain days (154h) 164h sun
Thermal 6
Sky 7
Rain 6
Wind 10
Higher = better, including rain & wind (green = "doesn't hurt the score", not "lots of it").
October 4/10
feels 12°C
(+1°C vs 1991-2020) · HCI 37/100
Day 14° · Night 9°
80% humidity 22 km/h wind 18 rain days (255h) 128h sun
Thermal 4
Sky 3
Rain 2
Wind 10
Higher = better, including rain & wind (green = "doesn't hurt the score", not "lots of it").
November 4/10
feels 8°C
· HCI 41/100
Day 11° · Night 6°
84% humidity 22 km/h wind 15 rain days (183h) 94h sun
Thermal 2
Sky 4
Rain 5
Wind 10
Higher = better, including rain & wind (green = "doesn't hurt the score", not "lots of it").
December 3/10
feels 6°C
· HCI 34/100
Day 9° · Night 5°
85% humidity 24 km/h wind 17 rain days (191h) 81h sun
Thermal 1
Sky 4
Rain 4
Wind 9
Higher = better, including rain & wind (green = "doesn't hurt the score", not "lots of it").
January 1–10 4/10
feels 4°C
(−1°C vs 1991-2020) · HCI 40/100
Day 8° · Night 3°
85% humidity 22 km/h wind 4 rain days (47h) 31h sun
Thermal 1
Sky 4
Rain 6
Wind 10
Higher = better, including rain & wind (green = "doesn't hurt the score", not "lots of it").
January 11–20 4/10
feels 5°C
· HCI 41/100
Day 8° · Night 2°
84% humidity 19 km/h wind 4 rain days (50h) 34h sun
Thermal 1
Sky 5
Rain 6
Wind 10
Higher = better, including rain & wind (green = "doesn't hurt the score", not "lots of it").
January 21–31 4/10
feels 6°C
(+1°C vs 1991-2020) · HCI 43/100
Day 9° · Night 4°
85% humidity 19 km/h wind 3 rain days (49h) 28h sun
Thermal 1
Sky 4
Rain 6
Wind 10
Higher = better, including rain & wind (green = "doesn't hurt the score", not "lots of it").
February 1–10 4/10
feels 6°C
(+1°C vs 1991-2020) · HCI 39/100
Day 10° · Night 5°
80% humidity 23 km/h wind 4 rain days (59h) 29h sun
Thermal 2
Sky 4
Rain 5
Wind 9
Higher = better, including rain & wind (green = "doesn't hurt the score", not "lots of it").
February 11–20 2/10
feels 7°C
(+2°C vs 1991-2020) · HCI 24/100
Day 11° · Night 5°
80% humidity 28 km/h wind 7 rain days (92h) 35h sun
Thermal 2
Sky 2
Rain 1
Wind 9
Higher = better, including rain & wind (green = "doesn't hurt the score", not "lots of it").
February 21–28 4/10
feels 5°C
· HCI 40/100
Day 9° · Night 4°
74% humidity 25 km/h wind 5 rain days (57h) 36h sun
Thermal 1
Sky 5
Rain 5
Wind 9
Higher = better, including rain & wind (green = "doesn't hurt the score", not "lots of it").
March 1–10 4/10
feels 5°C
(−1°C vs 1991-2020) · HCI 39/100
Day 9° · Night 3°
75% humidity 22 km/h wind 5 rain days (60h) 38h sun
Thermal 1
Sky 5
Rain 5
Wind 10
Higher = better, including rain & wind (green = "doesn't hurt the score", not "lots of it").
March 11–20 3/10
feels 8°C
(+1°C vs 1991-2020) · HCI 33/100
Day 11° · Night 5°
78% humidity 24 km/h wind 6 rain days (81h) 43h sun
Thermal 2
Sky 3
Rain 3
Wind 9
Higher = better, including rain & wind (green = "doesn't hurt the score", not "lots of it").
March 21–31 4/10
feels 8°C
· HCI 41/100
Day 12° · Night 5°
73% humidity 21 km/h wind 5 rain days (71h) 66h sun
Thermal 3
Sky 5
Rain 4
Wind 10
Higher = better, including rain & wind (green = "doesn't hurt the score", not "lots of it").
April 1–10 5/10
feels 8°C
· HCI 50/100
Day 12° · Night 5°
69% humidity 22 km/h wind 4 rain days (55h) 61h sun
Thermal 3
Sky 6
Rain 5
Wind 10
Higher = better, including rain & wind (green = "doesn't hurt the score", not "lots of it").
April 11–20 5/10
feels 9°C
· HCI 49/100
Day 12° · Night 6°
73% humidity 19 km/h wind 4 rain days (59h) 56h sun
Thermal 3
Sky 6
Rain 5
Wind 10
Higher = better, including rain & wind (green = "doesn't hurt the score", not "lots of it").
April 21–30 6/10
feels 11°C
(+1°C vs 1991-2020) · HCI 58/100
Day 13° · Night 6°
67% humidity 17 km/h wind 4 rain days (49h) 71h sun
Thermal 4
Sky 7
Rain 6
Wind 10
Higher = better, including rain & wind (green = "doesn't hurt the score", not "lots of it").
May 1–10 5/10
feels 12°C
(+1°C vs 1991-2020) · HCI 49/100
Day 14° · Night 8°
71% humidity 19 km/h wind 5 rain days (67h) 65h sun
Thermal 4
Sky 5
Rain 4
Wind 10
Higher = better, including rain & wind (green = "doesn't hurt the score", not "lots of it").
May 11–20 5/10
feels 13°C
(+1°C vs 1991-2020) · HCI 50/100
Day 15° · Night 8°
69% humidity 19 km/h wind 5 rain days (71h) 76h sun
Thermal 5
Sky 5
Rain 4
Wind 10
Higher = better, including rain & wind (green = "doesn't hurt the score", not "lots of it").
May 21–31 7/10
feels 14°C
· HCI 66/100
Day 16° · Night 9°
67% humidity 19 km/h wind 3 rain days (47h) 88h sun
Thermal 6
Sky 7
Rain 7
Wind 10
Higher = better, including rain & wind (green = "doesn't hurt the score", not "lots of it").
June 1–10 7/10
feels 15°C
· HCI 67/100
Day 17° · Night 10°
67% humidity 19 km/h wind 3 rain days (49h) 74h sun
Thermal 6
Sky 7
Rain 6
Wind 10
Higher = better, including rain & wind (green = "doesn't hurt the score", not "lots of it").
June 11–20 7/10
feels 17°C
(+1°C vs 1991-2020) · HCI 68/100
Day 18° · Night 11°
67% humidity 17 km/h wind 4 rain days (50h) 82h sun
Thermal 7
Sky 7
Rain 6
Wind 10
Higher = better, including rain & wind (green = "doesn't hurt the score", not "lots of it").
June 21–30 6/10
feels 17°C
(+1°C vs 1991-2020) · HCI 57/100
Day 18° · Night 11°
70% humidity 20 km/h wind 5 rain days (68h) 64h sun
Thermal 6
Sky 5
Rain 4
Wind 10
Higher = better, including rain & wind (green = "doesn't hurt the score", not "lots of it").
July 1–10 6/10
feels 16°C
(−1°C vs 1991-2020) · HCI 56/100
Day 18° · Night 11°
71% humidity 20 km/h wind 5 rain days (69h) 70h sun
Thermal 6
Sky 5
Rain 4
Wind 10
Higher = better, including rain & wind (green = "doesn't hurt the score", not "lots of it").
July 11–20 7/10
feels 19°C
(+1°C vs 1991-2020) · HCI 74/100
Day 20° · Night 12°
69% humidity 17 km/h wind 4 rain days (43h) 79h sun
Thermal 7
Sky 8
Rain 6
Wind 10
Higher = better, including rain & wind (green = "doesn't hurt the score", not "lots of it").
July 21–31 6/10
feels 19°C
(+1°C vs 1991-2020) · HCI 61/100
Day 19° · Night 13°
71% humidity 19 km/h wind 5 rain days (66h) 69h sun
Thermal 7
Sky 5
Rain 4
Wind 10
Higher = better, including rain & wind (green = "doesn't hurt the score", not "lots of it").
August 1–10 6/10
feels 18°C
· HCI 64/100
Day 19° · Night 12°
70% humidity 19 km/h wind 5 rain days (58h) 69h sun
Thermal 7
Sky 6
Rain 5
Wind 10
Higher = better, including rain & wind (green = "doesn't hurt the score", not "lots of it").
August 11–20 5/10
feels 19°C
(+1°C vs 1991-2020) · HCI 53/100
Day 20° · Night 13°
72% humidity 20 km/h wind 6 rain days (81h) 64h sun
Thermal 7
Sky 3
Rain 3
Wind 10
Higher = better, including rain & wind (green = "doesn't hurt the score", not "lots of it").
August 21–31 6/10
feels 17°C
· HCI 64/100
Day 19° · Night 12°
69% humidity 19 km/h wind 5 rain days (56h) 79h sun
Thermal 7
Sky 6
Rain 5
Wind 10
Higher = better, including rain & wind (green = "doesn't hurt the score", not "lots of it").
September 1–10 7/10
feels 18°C
(+2°C vs 1991-2020) · HCI 68/100
Day 19° · Night 13°
75% humidity 18 km/h wind 4 rain days (49h) 59h sun
Thermal 7
Sky 7
Rain 6
Wind 10
Higher = better, including rain & wind (green = "doesn't hurt the score", not "lots of it").
September 11–20 7/10
feels 16°C
(+1°C vs 1991-2020) · HCI 66/100
Day 17° · Night 11°
74% humidity 17 km/h wind 4 rain days (46h) 56h sun
Thermal 6
Sky 7
Rain 6
Wind 10
Higher = better, including rain & wind (green = "doesn't hurt the score", not "lots of it").
September 21–30 5/10
feels 13°C
(−1°C vs 1991-2020) · HCI 54/100
Day 16° · Night 9°
75% humidity 22 km/h wind 5 rain days (59h) 49h sun
Thermal 5
Sky 6
Rain 5
Wind 9
Higher = better, including rain & wind (green = "doesn't hurt the score", not "lots of it").
October 1–10 5/10
feels 13°C
· HCI 48/100
Day 15° · Night 9°
77% humidity 21 km/h wind 5 rain days (69h) 49h sun
Thermal 4
Sky 5
Rain 4
Wind 10
Higher = better, including rain & wind (green = "doesn't hurt the score", not "lots of it").
October 11–20 4/10
feels 12°C
(+1°C vs 1991-2020) · HCI 38/100
Day 14° · Night 9°
80% humidity 21 km/h wind 6 rain days (82h) 37h sun
Thermal 4
Sky 3
Rain 3
Wind 10
Higher = better, including rain & wind (green = "doesn't hurt the score", not "lots of it").
October 21–31 3/10
feels 11°C
(+1°C vs 1991-2020) · HCI 26/100
Day 13° · Night 8°
82% humidity 23 km/h wind 7 rain days (104h) 42h sun
Thermal 3
Sky 1
Rain 1
Wind 9
Higher = better, including rain & wind (green = "doesn't hurt the score", not "lots of it").
November 1–10 4/10
feels 9°C
· HCI 44/100
Day 12° · Night 8°
82% humidity 21 km/h wind 5 rain days (63h) 35h sun
Thermal 3
Sky 5
Rain 4
Wind 10
Higher = better, including rain & wind (green = "doesn't hurt the score", not "lots of it").
November 11–20 4/10
feels 9°C
(+1°C vs 1991-2020) · HCI 37/100
Day 12° · Night 7°
85% humidity 22 km/h wind 6 rain days (70h) 27h sun
Thermal 2
Sky 4
Rain 3
Wind 10
Higher = better, including rain & wind (green = "doesn't hurt the score", not "lots of it").
November 21–30 4/10
feels 6°C
(−1°C vs 1991-2020) · HCI 42/100
Day 10° · Night 5°
85% humidity 22 km/h wind 4 rain days (50h) 31h sun
Thermal 2
Sky 4
Rain 6
Wind 10
Higher = better, including rain & wind (green = "doesn't hurt the score", not "lots of it").
December 1–10 4/10
feels 4°C
(−2°C vs 1991-2020) · HCI 42/100
Day 8° · Night 3°
82% humidity 24 km/h wind 4 rain days (42h) 34h sun
Thermal 1
Sky 5
Rain 6
Wind 9
Higher = better, including rain & wind (green = "doesn't hurt the score", not "lots of it").
December 11–20 3/10
feels 6°C
· HCI 34/100
Day 9° · Night 5°
88% humidity 22 km/h wind 5 rain days (62h) 22h sun
Thermal 1
Sky 3
Rain 4
Wind 10
Higher = better, including rain & wind (green = "doesn't hurt the score", not "lots of it").
December 21–31 2/10
feels 6°C
(+1°C vs 1991-2020) · HCI 24/100
Day 10° · Night 6°
86% humidity 25 km/h wind 8 rain days (87h) 25h sun
Thermal 1
Sky 3
Rain 1
Wind 9
Higher = better, including rain & wind (green = "doesn't hurt the score", not "lots of it").
 Private Ring of Kerry Highlights Tour from Cork, Car or Minibus
 Rebel City Distillery Tour
 Cork Midleton DistilleryJameson Experience & Whiskey Tasting
 Hysterical Histories Cork Pick your own Path Walking tours
 Electric Bike Tour in Kinsale Town Cork Ireland
 Wild Coast Bike and EBike Tour in Kinsale Cork Ireland
 Cobh (Cork) to Blarney Castle & Kinsale - Shore Excursion