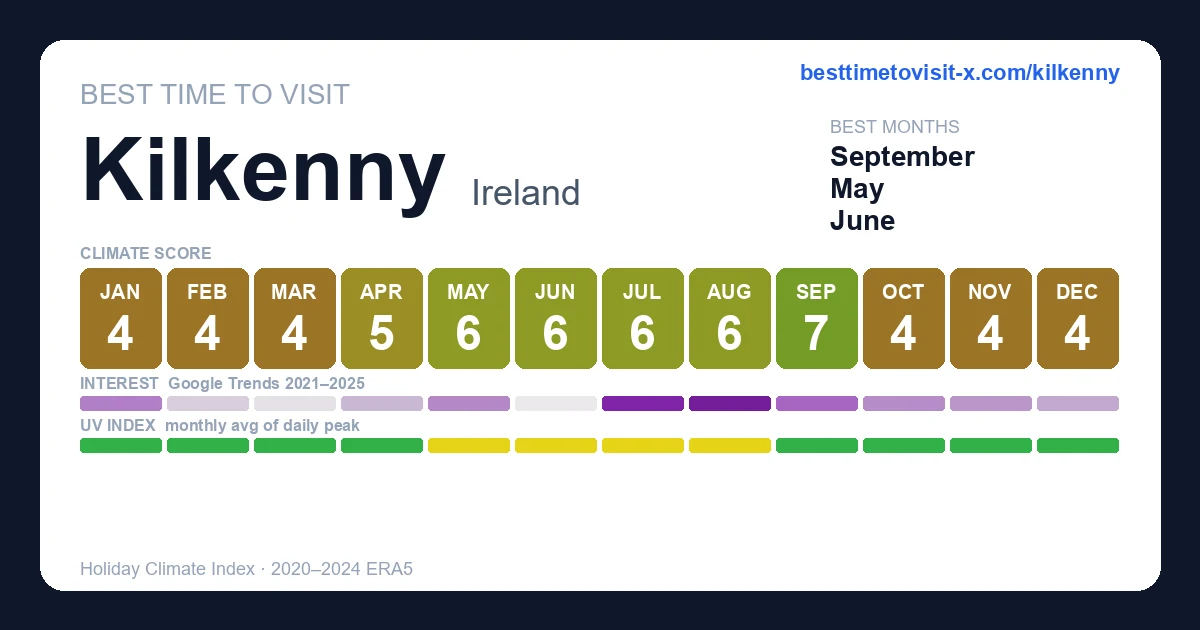
January 4/10
feels 4°C
· HCI 39/100
Day 8° · Night 3°
85% humidity 22 km/h wind 13 rain days (131h) 88h sun
Thermal 1
Sky 4
Rain 6
Wind 10
Higher = better, including rain & wind (green = "doesn't hurt the score", not "lots of it").
February 4/10
feels 5°C
· HCI 43/100
Day 8° · Night 3°
80% humidity 22 km/h wind 12 rain days (123h) 110h sun
Thermal 1
Sky 5
Rain 6
Wind 10
Higher = better, including rain & wind (green = "doesn't hurt the score", not "lots of it").
March 5/10
feels 6°C
(−1°C vs 2020-2024) · HCI 51/100
Day 10° · Night 3°
74% humidity 21 km/h wind 12 rain days (129h) 155h sun
Thermal 2
Sky 7
Rain 6
Wind 10
Higher = better, including rain & wind (green = "doesn't hurt the score", not "lots of it").
April 5/10
feels 9°C
· HCI 54/100
Day 12° · Night 5°
69% humidity 20 km/h wind 13 rain days (145h) 200h sun
Thermal 3
Sky 7
Rain 6
Wind 10
Higher = better, including rain & wind (green = "doesn't hurt the score", not "lots of it").
May 6/10
feels 13°C
· HCI 60/100
Day 15° · Night 8°
68% humidity 19 km/h wind 13 rain days (147h) 233h sun
Thermal 5
Sky 7
Rain 6
Wind 10
Higher = better, including rain & wind (green = "doesn't hurt the score", not "lots of it").
June 7/10
feels 16°C
· HCI 67/100
Day 17° · Night 10°
68% humidity 18 km/h wind 12 rain days (140h) 223h sun
Thermal 6
Sky 7
Rain 6
Wind 10
Higher = better, including rain & wind (green = "doesn't hurt the score", not "lots of it").
July 7/10
feels 18°C
· HCI 69/100
Day 19° · Night 12°
70% humidity 18 km/h wind 13 rain days (143h) 211h sun
Thermal 7
Sky 7
Rain 6
Wind 10
Higher = better, including rain & wind (green = "doesn't hurt the score", not "lots of it").
August 7/10
feels 17°C
(−1°C vs 2020-2024) · HCI 70/100
Day 19° · Night 12°
71% humidity 18 km/h wind 12 rain days (136h) 199h sun
Thermal 7
Sky 7
Rain 6
Wind 10
Higher = better, including rain & wind (green = "doesn't hurt the score", not "lots of it").
September 7/10
feels 15°C
(−1°C vs 2020-2024) · HCI 67/100
Day 16° · Night 10°
74% humidity 19 km/h wind 11 rain days (114h) 162h sun
Thermal 5
Sky 8
Rain 7
Wind 10
Higher = better, including rain & wind (green = "doesn't hurt the score", not "lots of it").
October 5/10
feels 11°C
· HCI 55/100
Day 13° · Night 8°
79% humidity 21 km/h wind 12 rain days (128h) 132h sun
Thermal 3
Sky 6
Rain 6
Wind 10
Higher = better, including rain & wind (green = "doesn't hurt the score", not "lots of it").
November 4/10
feels 7°C
(−1°C vs 2020-2024) · HCI 44/100
Day 10° · Night 5°
85% humidity 21 km/h wind 13 rain days (131h) 94h sun
Thermal 2
Sky 4
Rain 6
Wind 10
Higher = better, including rain & wind (green = "doesn't hurt the score", not "lots of it").
December 4/10
feels 5°C
· HCI 39/100
Day 8° · Night 3°
87% humidity 21 km/h wind 13 rain days (130h) 78h sun
Thermal 1
Sky 4
Rain 6
Wind 10
Higher = better, including rain & wind (green = "doesn't hurt the score", not "lots of it").
January 1–10 4/10
feels 4°C
· HCI 40/100
Day 8° · Night 3°
85% humidity 23 km/h wind 4 rain days (40h) 27h sun
Thermal 1
Sky 4
Rain 7
Wind 9
Higher = better, including rain & wind (green = "doesn't hurt the score", not "lots of it").
January 11–20 4/10
feels 4°C
· HCI 39/100
Day 8° · Night 3°
85% humidity 23 km/h wind 4 rain days (45h) 28h sun
Thermal 1
Sky 4
Rain 6
Wind 9
Higher = better, including rain & wind (green = "doesn't hurt the score", not "lots of it").
January 21–31 4/10
feels 4°C
(−1°C vs 2020-2024) · HCI 41/100
Day 8° · Night 3°
84% humidity 21 km/h wind 4 rain days (46h) 33h sun
Thermal 1
Sky 5
Rain 6
Wind 10
Higher = better, including rain & wind (green = "doesn't hurt the score", not "lots of it").
February 1–10 4/10
feels 4°C
(−1°C vs 2020-2024) · HCI 41/100
Day 8° · Night 3°
82% humidity 23 km/h wind 4 rain days (46h) 36h sun
Thermal 1
Sky 5
Rain 6
Wind 9
Higher = better, including rain & wind (green = "doesn't hurt the score", not "lots of it").
February 11–20 4/10
feels 5°C
(−1°C vs 2020-2024) · HCI 45/100
Day 8° · Night 3°
80% humidity 21 km/h wind 4 rain days (39h) 39h sun
Thermal 1
Sky 6
Rain 7
Wind 10
Higher = better, including rain & wind (green = "doesn't hurt the score", not "lots of it").
February 21–28 5/10
feels 5°C
· HCI 45/100
Day 9° · Night 3°
77% humidity 23 km/h wind 3 rain days (38h) 35h sun
Thermal 1
Sky 5
Rain 7
Wind 9
Higher = better, including rain & wind (green = "doesn't hurt the score", not "lots of it").
March 1–10 5/10
feels 5°C
(+1°C vs 2020-2024) · HCI 46/100
Day 9° · Night 3°
76% humidity 22 km/h wind 5 rain days (43h) 48h sun
Thermal 1
Sky 7
Rain 6
Wind 9
Higher = better, including rain & wind (green = "doesn't hurt the score", not "lots of it").
March 11–20 5/10
feels 7°C
· HCI 52/100
Day 10° · Night 4°
74% humidity 21 km/h wind 3 rain days (40h) 47h sun
Thermal 2
Sky 7
Rain 7
Wind 10
Higher = better, including rain & wind (green = "doesn't hurt the score", not "lots of it").
March 21–31 5/10
feels 7°C
(−1°C vs 2020-2024) · HCI 52/100
Day 11° · Night 4°
71% humidity 20 km/h wind 4 rain days (46h) 61h sun
Thermal 2
Sky 7
Rain 6
Wind 10
Higher = better, including rain & wind (green = "doesn't hurt the score", not "lots of it").
April 1–10 5/10
feels 8°C
· HCI 54/100
Day 11° · Night 4°
70% humidity 21 km/h wind 4 rain days (45h) 64h sun
Thermal 3
Sky 8
Rain 6
Wind 10
Higher = better, including rain & wind (green = "doesn't hurt the score", not "lots of it").
April 11–20 6/10
feels 9°C
· HCI 57/100
Day 12° · Night 5°
68% humidity 19 km/h wind 4 rain days (42h) 66h sun
Thermal 3
Sky 8
Rain 6
Wind 10
Higher = better, including rain & wind (green = "doesn't hurt the score", not "lots of it").
April 21–30 5/10
feels 10°C
(−1°C vs 2020-2024) · HCI 51/100
Day 13° · Night 6°
70% humidity 20 km/h wind 5 rain days (57h) 69h sun
Thermal 4
Sky 6
Rain 5
Wind 10
Higher = better, including rain & wind (green = "doesn't hurt the score", not "lots of it").
May 1–10 6/10
feels 11°C
(−1°C vs 2020-2024) · HCI 60/100
Day 14° · Night 7°
67% humidity 19 km/h wind 4 rain days (45h) 76h sun
Thermal 4
Sky 8
Rain 6
Wind 10
Higher = better, including rain & wind (green = "doesn't hurt the score", not "lots of it").
May 11–20 6/10
feels 12°C
(−1°C vs 2020-2024) · HCI 60/100
Day 15° · Night 7°
68% humidity 19 km/h wind 4 rain days (49h) 74h sun
Thermal 5
Sky 7
Rain 6
Wind 10
Higher = better, including rain & wind (green = "doesn't hurt the score", not "lots of it").
May 21–31 6/10
feels 14°C
· HCI 61/100
Day 16° · Night 9°
67% humidity 18 km/h wind 5 rain days (52h) 83h sun
Thermal 5
Sky 7
Rain 5
Wind 10
Higher = better, including rain & wind (green = "doesn't hurt the score", not "lots of it").
June 1–10 6/10
feels 15°C
· HCI 64/100
Day 17° · Night 10°
68% humidity 18 km/h wind 4 rain days (52h) 77h sun
Thermal 6
Sky 7
Rain 6
Wind 10
Higher = better, including rain & wind (green = "doesn't hurt the score", not "lots of it").
June 11–20 7/10
feels 16°C
(−1°C vs 2020-2024) · HCI 69/100
Day 17° · Night 10°
67% humidity 18 km/h wind 4 rain days (44h) 73h sun
Thermal 6
Sky 8
Rain 6
Wind 10
Higher = better, including rain & wind (green = "doesn't hurt the score", not "lots of it").
June 21–30 7/10
feels 17°C
· HCI 70/100
Day 18° · Night 11°
68% humidity 18 km/h wind 4 rain days (43h) 73h sun
Thermal 7
Sky 8
Rain 6
Wind 10
Higher = better, including rain & wind (green = "doesn't hurt the score", not "lots of it").
July 1–10 7/10
feels 17°C
(+1°C vs 2020-2024) · HCI 68/100
Day 19° · Night 12°
71% humidity 18 km/h wind 4 rain days (49h) 67h sun
Thermal 7
Sky 7
Rain 6
Wind 10
Higher = better, including rain & wind (green = "doesn't hurt the score", not "lots of it").
July 11–20 7/10
feels 18°C
(−1°C vs 2020-2024) · HCI 71/100
Day 19° · Night 12°
69% humidity 17 km/h wind 4 rain days (46h) 70h sun
Thermal 7
Sky 7
Rain 6
Wind 10
Higher = better, including rain & wind (green = "doesn't hurt the score", not "lots of it").
July 21–31 7/10
feels 18°C
· HCI 70/100
Day 19° · Night 13°
71% humidity 18 km/h wind 4 rain days (48h) 74h sun
Thermal 7
Sky 7
Rain 6
Wind 10
Higher = better, including rain & wind (green = "doesn't hurt the score", not "lots of it").
August 1–10 7/10
feels 18°C
· HCI 70/100
Day 19° · Night 13°
71% humidity 17 km/h wind 4 rain days (48h) 65h sun
Thermal 7
Sky 7
Rain 6
Wind 10
Higher = better, including rain & wind (green = "doesn't hurt the score", not "lots of it").
August 11–20 7/10
feels 18°C
(−1°C vs 2020-2024) · HCI 68/100
Day 19° · Night 12°
71% humidity 18 km/h wind 4 rain days (49h) 63h sun
Thermal 7
Sky 7
Rain 6
Wind 10
Higher = better, including rain & wind (green = "doesn't hurt the score", not "lots of it").
August 21–31 7/10
feels 17°C
· HCI 72/100
Day 18° · Night 11°
71% humidity 18 km/h wind 3 rain days (40h) 70h sun
Thermal 6
Sky 8
Rain 7
Wind 10
Higher = better, including rain & wind (green = "doesn't hurt the score", not "lots of it").
September 1–10 7/10
feels 16°C
(−3°C vs 2020-2024) · HCI 72/100
Day 18° · Night 11°
73% humidity 18 km/h wind 3 rain days (37h) 59h sun
Thermal 6
Sky 8
Rain 7
Wind 10
Higher = better, including rain & wind (green = "doesn't hurt the score", not "lots of it").
September 11–20 7/10
feels 14°C
(−2°C vs 2020-2024) · HCI 69/100
Day 16° · Night 10°
73% humidity 19 km/h wind 3 rain days (35h) 55h sun
Thermal 5
Sky 8
Rain 7
Wind 10
Higher = better, including rain & wind (green = "doesn't hurt the score", not "lots of it").
September 21–30 6/10
feels 14°C
(+1°C vs 2020-2024) · HCI 61/100
Day 16° · Night 9°
76% humidity 19 km/h wind 4 rain days (42h) 48h sun
Thermal 5
Sky 7
Rain 6
Wind 10
Higher = better, including rain & wind (green = "doesn't hurt the score", not "lots of it").
October 1–10 6/10
feels 12°C
(−1°C vs 2020-2024) · HCI 58/100
Day 14° · Night 9°
77% humidity 21 km/h wind 4 rain days (38h) 45h sun
Thermal 4
Sky 6
Rain 7
Wind 10
Higher = better, including rain & wind (green = "doesn't hurt the score", not "lots of it").
October 11–20 6/10
feels 11°C
· HCI 56/100
Day 13° · Night 8°
78% humidity 19 km/h wind 4 rain days (40h) 44h sun
Thermal 3
Sky 6
Rain 7
Wind 10
Higher = better, including rain & wind (green = "doesn't hurt the score", not "lots of it").
October 21–31 5/10
feels 10°C
· HCI 49/100
Day 12° · Night 7°
81% humidity 22 km/h wind 5 rain days (50h) 43h sun
Thermal 3
Sky 6
Rain 5
Wind 10
Higher = better, including rain & wind (green = "doesn't hurt the score", not "lots of it").
November 1–10 5/10
feels 8°C
(−1°C vs 2020-2024) · HCI 48/100
Day 11° · Night 6°
83% humidity 21 km/h wind 4 rain days (43h) 36h sun
Thermal 2
Sky 5
Rain 6
Wind 10
Higher = better, including rain & wind (green = "doesn't hurt the score", not "lots of it").
November 11–20 4/10
feels 7°C
(−1°C vs 2020-2024) · HCI 43/100
Day 10° · Night 5°
84% humidity 21 km/h wind 4 rain days (47h) 30h sun
Thermal 2
Sky 4
Rain 6
Wind 10
Higher = better, including rain & wind (green = "doesn't hurt the score", not "lots of it").
November 21–30 4/10
feels 6°C
(+1°C vs 2020-2024) · HCI 42/100
Day 9° · Night 4°
86% humidity 21 km/h wind 4 rain days (42h) 28h sun
Thermal 1
Sky 4
Rain 6
Wind 10
Higher = better, including rain & wind (green = "doesn't hurt the score", not "lots of it").
December 1–10 4/10
feels 5°C
(+2°C vs 2020-2024) · HCI 41/100
Day 9° · Night 4°
86% humidity 22 km/h wind 4 rain days (41h) 27h sun
Thermal 1
Sky 4
Rain 6
Wind 10
Higher = better, including rain & wind (green = "doesn't hurt the score", not "lots of it").
December 11–20 4/10
feels 5°C
· HCI 39/100
Day 8° · Night 3°
87% humidity 21 km/h wind 4 rain days (42h) 24h sun
Thermal 1
Sky 3
Rain 6
Wind 10
Higher = better, including rain & wind (green = "doesn't hurt the score", not "lots of it").
December 21–31 4/10
feels 4°C
(−1°C vs 2020-2024) · HCI 37/100
Day 8° · Night 3°
87% humidity 22 km/h wind 5 rain days (47h) 27h sun
Thermal 1
Sky 4
Rain 6
Wind 10
Higher = better, including rain & wind (green = "doesn't hurt the score", not "lots of it").
 Smithwick's Experience Kilkenny Entrance Ticket
 Shenanigans Walks - Guided Walking Tour in Kilkenny
 Scenic Kayaking Adventure on the Nore River
 Kilkenny Castle, Witches and Hidden Laneways Walking Tour
 Private Airport Transfer from Kilkenny City to Dublin Airport
 Cliffs of Moher including Cliffs of Moher Boat Experience Luxury Car Tour