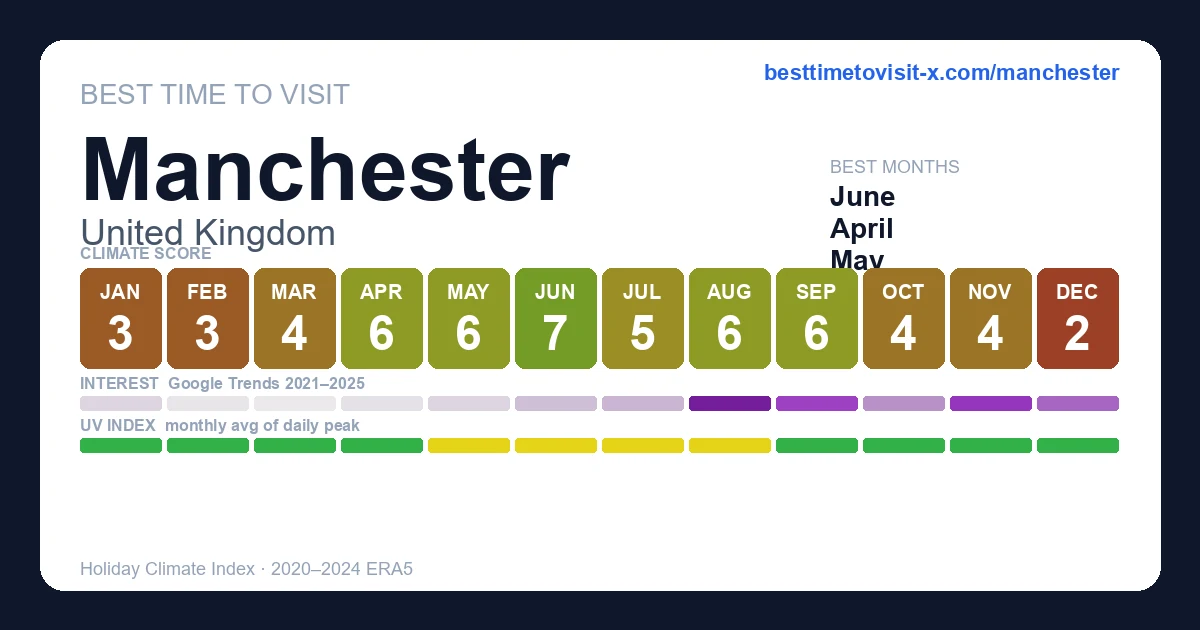
Best time to visit Manchester
Re-score for me — drag the dial — every chart on the page recolours live for your heat limit 27°C
Default 27 °C is the upper edge of the Holiday Climate Index "ideal comfort" band (Scott, Rutty, Amelung & Tang, 2016). Above this, most warm-tourism travellers report measurable discomfort.
How is this scored? HCI / Steadman / CCI gate — full methodology and citations below.
Compare with another destination
Add as many as you like — stacked below the main strips above. Each row is just the recent-window score strip and (for beach destinations) sea-temperature strip.
Tours in Manchester
14 top-rated tours via Viator. Booking links earn this site a commission at no cost to you.
- 1
 Manchester Taxi Tours with Mike
 - 2
 Manchester Food Tour with Full Meal and Drinks by Do Eat Better
 - 3
 Four hour walking wine tasting tour of Manchester's best bars
 - 4
 Half-Day Manchester Food Tour with Lunch
 - 5
 A Silent Disco Adventure in Manchester
 - 6
 Off the beaten track Manchester Food Tour
 - 7
 Step Inside the Game Show – The Crystal Maze LIVE Experience
 - 8
 Manchester Afternoon Walking Tour
 - 9
 Alcotraz Prison Cocktail Experience in Manchester
 - 10
 Rock and Goal Manchester Walking Tour
 - 11
 The Manchester City Stadium Tour
 - 12
 Pride & Prejudice Peak District full day tour
 - 13
 3-Day Lake District Explorer Small-Group Tour from Manchester
 - 14
 4 Day Journey to Scotland from Manchester Including Admissions
Last refreshed 2026-06-14.
Similar climatesGlasgow93% · Liverpool93% · Giant's Causeway93%
Other destinations with the most-alike year-round climate to Manchester (apparent temperature, rain hours, sunshine — matched within the same trip-profile). The ±N chip compares each match's typical score for the current month against Manchester's. Based on the 2020-2024 climatology, not this year's actual weather.
Month-by-month
| Month | Temp °C | Feels °C | Rain days | Rain h | Rain h/day | Humidity | Wind km/h | Sun h | UV | Interest | Score |
|---|---|---|---|---|---|---|---|---|---|---|---|
| Jan | 2–7 | 4 | 16 | 192 | 12.0 | 84% | 22 | 72 | — | Quiet | 3 |
| Feb | 3–9 | 5 | 19 | 251 | 13.2 | 78% | 26 | 90 | 1 | Quiet | 3 |
| Mar | 3–11 | 7 | 14 | 201 | 14.4 | 69% | 23 | 155 | 2 | Quiet | 4 |
| Apr | 4–13 | 10 | 12 | 155 | 12.9 | 61% | 21 | 215 | 3 | Quiet | 6 |
| May | 8–16 | 14 | 15 | 185 | 12.3 | 64% | 19 | 234 | 4 | Quiet | 6 |
| Jun | 11–19 | 18 | 14 | 168 | 12.0 | 62% | 19 | 243 | 4 | Quiet | 7 |
| Jul | 13–20 | 19 | 20 | 273 | 13.7 | 68% | 19 | 212 | 4 | Quiet | 5 |
| Aug | 13–20 | 19 | 18 | 221 | 12.3 | 68% | 20 | 220 | 4 | Peak | 6 |
| Sep | 11–18 | 17 | 14 | 164 | 11.7 | 71% | 19 | 173 | 3 | Busy | 6 |
| Oct | 9–14 | 12 | 20 | 231 | 11.6 | 78% | 22 | 121 | 1 | Moderate | 4 |
| Nov | 5–10 | 8 | 16 | 191 | 11.9 | 83% | 20 | 84 | 1 | Busy | 4 |
| Dec | 3–8 | 5 | 20 | 251 | 12.6 | 86% | 21 | 56 | — | Moderate | 2 |
UV Index in Manchester by Month
UV index in Manchester peaks at 4 (moderate) in June, dropping to 0 (low) in January.
Best months in detail
June
7/1011–19°C (feels 18°C) · 14 rain days (168h) · 243 sun hours · 62% humidity · Quiet crowd · UV 4 (moderate) · sunniest 1 in 10 days reach 6 (high)
September
6/1011–18°C (feels 17°C) · 14 rain days (164h) · 173 sun hours · 71% humidity · Busy crowd · UV 3 (low) · sunniest 1 in 10 days reach 4 (moderate)
August
6/1013–20°C (feels 19°C) · 18 rain days (221h) · 220 sun hours · 68% humidity · Peak crowd · UV 4 (moderate) · sunniest 1 in 10 days reach 5 (moderate)
Every month
Show the other 9 months in detail
January
3/102–7°C (feels 4°C) · 16 rain days (192h) · 72 sun hours · 84% humidity · Quiet crowd
February
3/103–9°C (feels 5°C) · 19 rain days (251h) · 90 sun hours · 78% humidity · Quiet crowd · UV 1 (low)
March
4/103–11°C (feels 7°C) · 14 rain days (201h) · 155 sun hours · 69% humidity · Quiet crowd · UV 2 (low)
April
6/104–13°C (feels 10°C) · 12 rain days (155h) · 215 sun hours · 61% humidity · Quiet crowd · UV 3 (low) · sunniest 1 in 10 days reach 4 (moderate)
May
6/108–16°C (feels 14°C) · 15 rain days (185h) · 234 sun hours · 64% humidity · Quiet crowd · UV 4 (moderate) · sunniest 1 in 10 days reach 6 (moderate)
July
5/1013–20°C (feels 19°C) · 20 rain days (273h) · 212 sun hours · 68% humidity · Quiet crowd · UV 4 (moderate) · sunniest 1 in 10 days reach 6 (moderate)
October
4/109–14°C (feels 12°C) · 20 rain days (231h) · 121 sun hours · 78% humidity · Moderate crowd · UV 1 (low)
November
4/105–10°C (feels 8°C) · 16 rain days (191h) · 84 sun hours · 83% humidity · Busy crowd · UV 1 (low)
December
2/103–8°C (feels 5°C) · 20 rain days (251h) · 56 sun hours · 86% humidity · Moderate crowd
Frequently asked questions about visiting Manchester
When is the best time to visit Manchester?
June is the highest-scoring month (7/10 on the Holiday Climate Index). Typical conditions: 11–19°C (14 rainy days). The top three months by score are June, September, August.
What is the worst time to visit Manchester?
December is the lowest-scoring month (2/10). Typical conditions: 3–8°C (20 rainy days).
When are crowds lowest in Manchester?
Search-interest seasonality (Google Trends 2021-2025) is lowest in March and peaks in August. Interest tracks both in-trip visitors and lead-time planners, so treat it as a "destination is on people's minds" signal rather than literal arrivals.
Which months in Manchester have good weather but fewer tourists?
June (climate 7/10, crowd index 23) and April (climate 6/10, crowd index 4) — shoulder months with above-average climate and below-median search-interest. Often the best value-for-weather trade.
What is the UV index in Manchester by month?
UV peaks at 4 (moderate) in June and is lowest in January at 0 (low). Monthly peak values: Jan —, Feb 1, Mar 2, Apr 3, May 4, Jun 4, Jul 4, Aug 4, Sep 3, Oct 1, Nov 1, Dec —.
What is the UV index in Manchester in June?
June is the peak UV month in Manchester, with a daily-peak UV index of 4 (moderate). Standard sun protection — sunglasses and light SPF — is recommended.
How high can UV get in Manchester on the sunniest days?
Most days look like the monthly average, but on the sunniest ~1 in 10 days UV climbs higher than the mean suggests. June is the worst case: typical days average UV 4 (moderate), but the top 10% of days reach UV 6 (high) — and even higher. Months where the sunniest days routinely exceed the typical reading: April, May, June, July, August, September. Plan sun protection for the worst case, not the average.
Is air quality in Manchester bad for travelers?
PM2.5 (fine-particle pollution) exceeds the WHO sensitive-group guideline (15 µg/m³) in 7 months: January, February, March, April, May, November, December. The worst month is March with a typical-day mean of 12 µg/m³ (moderate); on the worst 10% of days PM2.5 reaches 23 µg/m³ (unhealthy for sensitive) and higher. People with asthma, heart conditions, or sensitive children may want to avoid these months or limit outdoor activity. Source: CAMS via Open-Meteo.