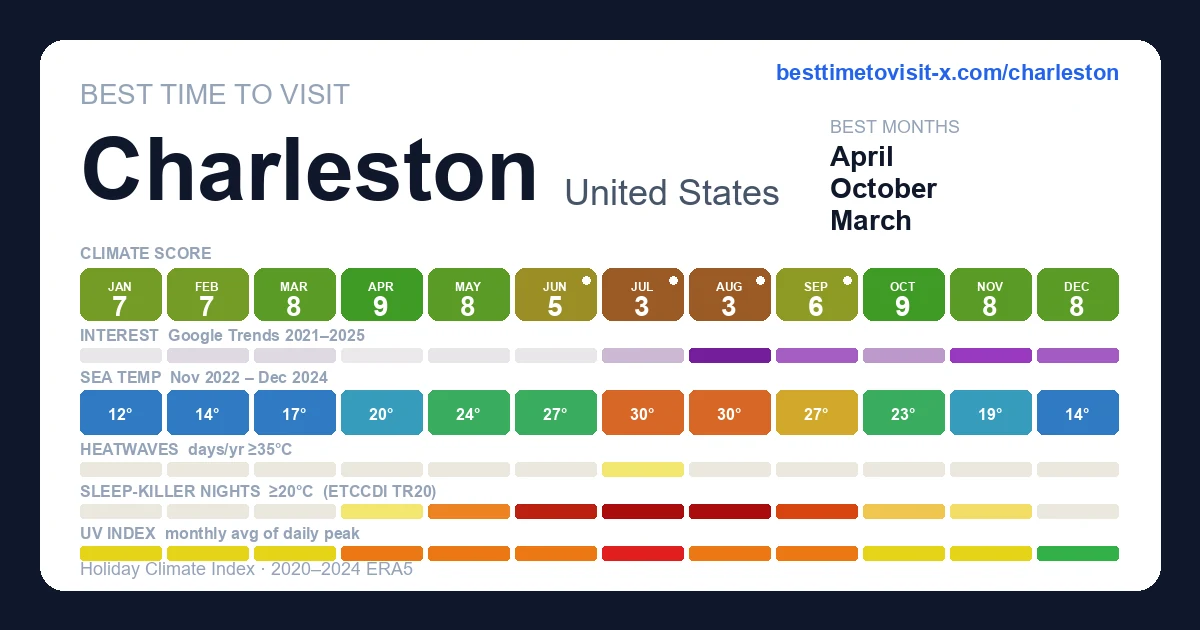
Best time to visit Charleston
Re-score for me — drag the dial — every chart recolours live for your heat & sea limits 27°C · sea 29°C
Default 27 °C is the upper edge of the Holiday Climate Index "ideal comfort" band (Scott, Rutty, Amelung & Tang, 2016). Above this, most warm-tourism travellers report measurable discomfort.
Default 29 °C is the Beach Climate Index "bathtub" line (Morgan et al.) — where the sea stops being refreshing and starts feeling like a warm bath.
Greyed factors are scored normally — extreme heat overrides them, so a clear sky or low rain can't lift the period.
Greyed factors are scored normally — extreme heat overrides them, so a clear sky or low rain can't lift the period.
Greyed factors are scored normally — extreme heat overrides them, so a clear sky or low rain can't lift the period.
Greyed factors are scored normally — extreme heat overrides them, so a clear sky or low rain can't lift the period.
Greyed factors are scored normally — extreme heat overrides them, so a clear sky or low rain can't lift the period.
Greyed factors are scored normally — extreme heat overrides them, so a clear sky or low rain can't lift the period.
Greyed factors are scored normally — extreme heat overrides them, so a clear sky or low rain can't lift the period.
Greyed factors are scored normally — extreme heat overrides them, so a clear sky or low rain can't lift the period.
Greyed factors are scored normally — extreme heat overrides them, so a clear sky or low rain can't lift the period.
Greyed factors are scored normally — extreme heat overrides them, so a clear sky or low rain can't lift the period.
Greyed factors are scored normally — extreme heat overrides them, so a clear sky or low rain can't lift the period.
Greyed factors are scored normally — extreme heat overrides them, so a clear sky or low rain can't lift the period.
Greyed factors are scored normally — extreme heat overrides them, so a clear sky or low rain can't lift the period.
Greyed factors are scored normally — extreme heat overrides them, so a clear sky or low rain can't lift the period.
Greyed factors are scored normally — extreme heat overrides them, so a clear sky or low rain can't lift the period.
Greyed factors are scored normally — extreme heat overrides them, so a clear sky or low rain can't lift the period.
Greyed factors are scored normally — extreme heat overrides them, so a clear sky or low rain can't lift the period.
Greyed factors are scored normally — extreme heat overrides them, so a clear sky or low rain can't lift the period.
Greyed factors are scored normally — extreme heat overrides them, so a clear sky or low rain can't lift the period.
Greyed factors are scored normally — extreme heat overrides them, so a clear sky or low rain can't lift the period.
Greyed factors are scored normally — extreme heat overrides them, so a clear sky or low rain can't lift the period.
Greyed factors are scored normally — extreme heat overrides them, so a clear sky or low rain can't lift the period.
Greyed factors are scored normally — extreme heat overrides them, so a clear sky or low rain can't lift the period.
Greyed factors are scored normally — extreme heat overrides them, so a clear sky or low rain can't lift the period.
Greyed factors are scored normally — extreme heat overrides them, so a clear sky or low rain can't lift the period.
Greyed factors are scored normally — extreme heat overrides them, so a clear sky or low rain can't lift the period.
Greyed factors are scored normally — extreme heat overrides them, so a clear sky or low rain can't lift the period.
Greyed factors are scored normally — extreme heat overrides them, so a clear sky or low rain can't lift the period.
Greyed factors are scored normally — extreme heat overrides them, so a clear sky or low rain can't lift the period.
Greyed factors are scored normally — extreme heat overrides them, so a clear sky or low rain can't lift the period.
How is this scored? HCI / Steadman / CCI gate — full methodology and citations below.
Compare with another destination
Add as many as you like — stacked below the main strips above. Each row is just the recent-window score strip and (for beach destinations) sea-temperature strip.
Tours in Charleston
25 top-rated tours via Viator. Booking links earn this site a commission at no cost to you. Map locations are approximate (centred on Charleston).
- 1
 Historic Charleston Guided Sightseeing Walking Tour
 - 2
 Charleston Eco Boat Cruise with stop at Morris Island Lighthouse
 - 3
 2-Hour Guided Kayak Eco Tour in Charleston
 - 4
 Undiscovered Charleston: Half Day Food, Wine & History Tour with Cooking Class
 - 5
 Charleston historical walking tour with a Professor of History at The Citadel
 - 6
 Highlights of Charleston Guided Walking Tour
 - 7
 Charleston History Tour - Small Groups Only - History & Alleyways
 - 8
 Private Sailing Charter with Captain, BYOB
 - 9
 Private Vacation Photoshoot with Photographer in Charleston
 - 10
 Afternoon Schooner Sightseeing Dolphin Cruise on Charleston Harbor
 - 11
 Downtown Charleston Food Tour
 - 12
 Hands-on Cooking Class in Charleston
 - 13
 Folly Beach Dolphin Viewing Boat Excursion and Estuary Tour
 - 14
 Book Charleston's Most Educational History Tour!
 - 15
 Charleston’s Old South Carriage Historic Horse & Carriage Tour
 - 16
 Charleston French Quarter or Brunch Food Tour with 7+ Tastings
 - 17
 Charleston Horse-Drawn Carriage Tour: Explore Historic Charleston
 - 18
 Hidden Alleyways and Historic Sites Small-Group Walking Tour
 - 19
 Real Hauntings of Charleston! (Small Group Ghost Tour)
 - 20
 Charleston Harbor Sunset Cruise
 - 21
 Charleston's Pleasing Terrors Night-Time Walking Ghost Tour
 - 22
 Charleston Haunted Booze and Boos Ghost Walking Tour
 - 23
 Historic Charleston Walking Tour: Rainbow Row, Churches, and More
 - 24
 Luxury Sunset Sail on Serendipity Catamaran in Charleston
 - 25
 City of the Dead: The Dark Hauntings of Charleston
Last refreshed 2026-05-25.
Similar climatesSitges83% · Barcelona83% · Tossa de Mar83%
Other destinations with the most-alike year-round climate to Charleston (apparent temperature, rain hours, sunshine — matched within the same trip-profile). The ±N chip compares each match's typical score for the current month against Charleston's. Based on the 2020-2024 climatology, not this year's actual weather.
Month-by-month
| Month | Temp °C | Feels °C | Rain days | Rain h | Rain h/day | Humidity | Wind km/h | Sun h | UV | Interest | Score |
|---|---|---|---|---|---|---|---|---|---|---|---|
| Jan | 7–15 | 12 | 11 | 92 | 8.4 | 67% | 23 | 175 | 3 | Quiet | 7 |
| Feb | 9–17 | 14 | 9 | 102 | 11.3 | 70% | 23 | 164 | 4 | Quiet | 7 |
| Mar | 12–20 | 18 | 10 | 100 | 10.0 | 66% | 24 | 204 | 6 | Quiet | 8 |
| Apr | 15–23 | 22 | 7 | 71 | 10.1 | 56% | 24 | 250 | 7 | Quiet | 9 |
| May | 19–26 | 26 | 11 | 111 | 10.1 | 60% | 23 | 267 | 7 | Quiet | 8 |
| Jun | 23–29 | 31 | 17 | 162 | 9.5 | 66% | 22 | 260 | 8 | Quiet | 5 |
| Jul | 25–31 | 35 | 18 | 196 | 10.9 | 69% | 20 | 264 | 8 | Quiet | 3 |
| Aug | 24–30 | 34 | 20 | 218 | 10.9 | 73% | 19 | 243 | 7 | Peak | 3 |
| Sep | 21–28 | 30 | 13 | 157 | 12.1 | 68% | 21 | 220 | 7 | Moderate | 6 |
| Oct | 17–24 | 25 | 6 | 71 | 11.8 | 65% | 19 | 223 | 5 | Moderate | 9 |
| Nov | 12–20 | 19 | 9 | 97 | 10.8 | 66% | 21 | 182 | 4 | Busy | 8 |
| Dec | 8–16 | 14 | 9 | 84 | 9.3 | 68% | 21 | 171 | 2 | Moderate | 8 |
UV Index in Charleston by Month
UV index in Charleston peaks at 8 (very high) in July, dropping to 2 (low) in December. July reach very high or extreme levels — apply SPF 50+, wear a hat and protective clothing, and limit direct sun between 11:00 and 17:00.
Best months in detail
April
9/1015–23°C (feels 22°C) · 7 rain days (71h) · 250 sun hours · 56% humidity · Quiet crowd · UV 7 (high) · sunniest 1 in 10 days reach 9 (very high)
October
9/1017–24°C · 6 rain days (71h) · 223 sun hours · 65% humidity · Moderate crowd · UV 5 (moderate) · sunniest 1 in 10 days reach 6 (high)
March
8/1012–20°C (feels 18°C) · 10 rain days (100h) · 204 sun hours · 66% humidity · Quiet crowd · UV 6 (moderate) · sunniest 1 in 10 days reach 7 (high)
Every month
Show the other 9 months in detail
January
7/107–15°C (feels 12°C) · 11 rain days (92h) · 175 sun hours · 67% humidity · Quiet crowd · UV 3 (moderate)
February
7/109–17°C (feels 14°C) · 9 rain days (102h) · 164 sun hours · 70% humidity · Quiet crowd · UV 4 (moderate)
May
8/1019–26°C · 11 rain days (111h) · 267 sun hours · 60% humidity · Quiet crowd · UV 7 (high) · sunniest 1 in 10 days reach 9 (very high)
June
5/1023–29°C (feels 31°C) · 17 rain days (162h) · 260 sun hours · 66% humidity · Quiet crowd · UV 8 (high) · sunniest 1 in 10 days reach 10 (very high)
July
3/1025–31°C (feels 35°C) · 18 rain days (196h) · 264 sun hours · 69% humidity · Quiet crowd · UV 8 (very high)
August
3/1024–30°C (feels 34°C) · 20 rain days (218h) · 243 sun hours · 73% humidity · Peak crowd · UV 7 (high) · sunniest 1 in 10 days reach 9 (very high)
September
6/1021–28°C (feels 30°C) · 13 rain days (157h) · 220 sun hours · 68% humidity · Moderate crowd · UV 7 (high) · sunniest 1 in 10 days reach 8 (very high)
November
8/1012–20°C (feels 19°C) · 9 rain days (97h) · 182 sun hours · 66% humidity · Busy crowd · UV 4 (moderate)
December
8/108–16°C (feels 14°C) · 9 rain days (84h) · 171 sun hours · 68% humidity · Moderate crowd · UV 2 (low) · sunniest 1 in 10 days reach 3 (moderate)
Comparisons people search for
Pairs validated by Google Autocomplete demand — only pairs people actually compare.
Frequently asked questions about visiting Charleston
When is the best time to visit Charleston?
April is the highest-scoring month (9/10 on the Holiday Climate Index). Typical conditions: 15–23°C (7 rainy days). The top three months by score are April, October, March.
What is the worst time to visit Charleston?
August is the lowest-scoring month (3/10, capped by extreme heat). Typical conditions: 24–30°C (20 rainy days).
Is Charleston too hot in summer?
4 months (June, July, August, September) trip the heat deal-breaker in our scoring: apparent temperature crosses the comfort cap, so even with clear skies and low rain the score is held down. Plan around it if heat tolerance is low.
When are crowds lowest in Charleston?
Search-interest seasonality (Google Trends 2021-2025) is lowest in April and peaks in August. Interest tracks both in-trip visitors and lead-time planners, so treat it as a "destination is on people's minds" signal rather than literal arrivals.
Which months in Charleston have good weather but fewer tourists?
April (climate 9/10, crowd index 0) and October (climate 9/10, crowd index 40) — shoulder months with above-average climate and below-median search-interest. Often the best value-for-weather trade.
What is the UV index in Charleston by month?
UV peaks at 8 (very high) in July and is lowest in December at 2 (low). Monthly peak values: Jan 3, Feb 4, Mar 6, Apr 7, May 7, Jun 8, Jul 8, Aug 7, Sep 7, Oct 5, Nov 4, Dec 2. July reach very high or extreme levels — apply SPF 50+, wear a hat and protective clothing, and limit direct sun between 11:00 and 17:00.
What is the UV index in Charleston in July?
July is the peak UV month in Charleston, with a daily-peak UV index of 8 (very high). At this level, sunburn can occur in under 20 minutes on unprotected fair skin. Apply SPF 50+, wear protective clothing and a hat, and avoid direct midday sun (11:00–17:00).
How high can UV get in Charleston on the sunniest days?
Most days look like the monthly average, but on the sunniest ~1 in 10 days UV climbs higher than the mean suggests. June is the worst case: typical days average UV 8 (high), but the top 10% of days reach UV 10 (very high) — and even higher. Months where the sunniest days routinely exceed the typical reading: March, April, May, June, August, September, October, December. Plan sun protection for the worst case, not the average.
Is air quality in Charleston bad for travelers?
PM2.5 (fine-particle pollution) exceeds the WHO sensitive-group guideline (15 µg/m³) in 6 months: January, February, March, June, July, August. The worst month is July with a typical-day mean of 12 µg/m³ (moderate); on the worst 10% of days PM2.5 reaches 17 µg/m³ (unhealthy for sensitive) and higher. People with asthma, heart conditions, or sensitive children may want to avoid these months or limit outdoor activity. Source: CAMS via Open-Meteo.