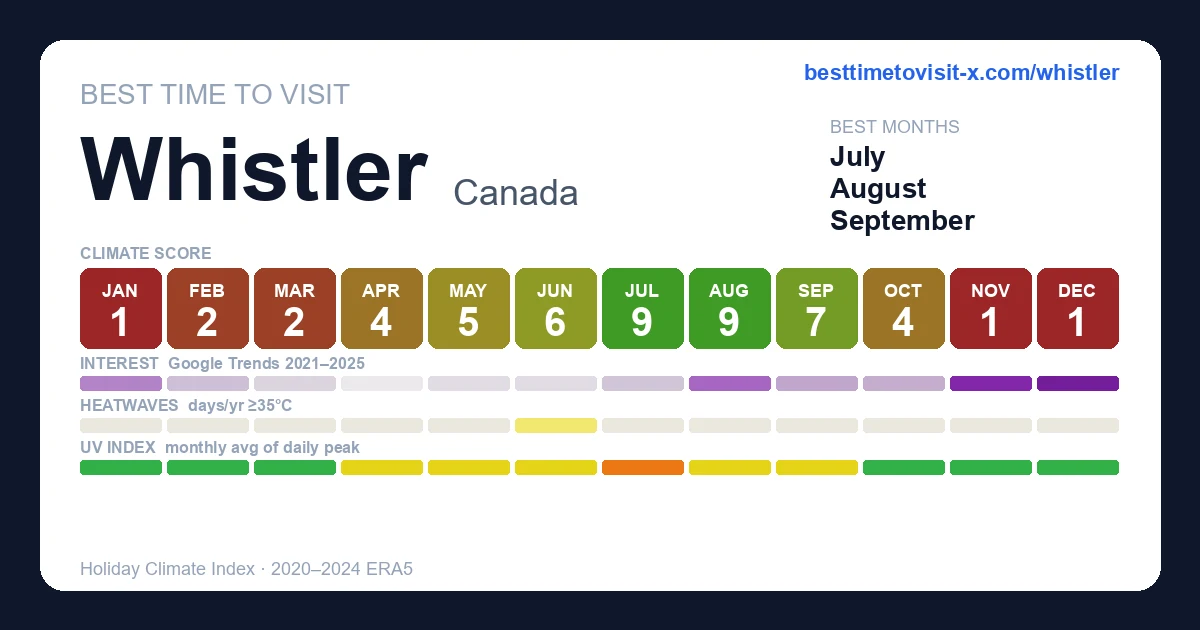
Best time to visit Whistler
Re-score for me — drag the dial — every chart on the page recolours live for your heat limit 27°C
Default 27 °C is the upper edge of the Holiday Climate Index "ideal comfort" band (Scott, Rutty, Amelung & Tang, 2016). Above this, most warm-tourism travellers report measurable discomfort.
How is this scored? HCI / Steadman / CCI gate — full methodology and citations below.
Compare with another destination
Add as many as you like — stacked below the main strips above. Each row is just the recent-window score strip and (for beach destinations) sea-temperature strip.
Tours in Whistler
16 top-rated tours via Viator. Booking links earn this site a commission at no cost to you. Map locations are approximate (centred on Whistler).
- 1
 Zipline Adventure in Whistler
 - 2
 Private Whistler Helicopter Tour: Glaciers and Black Tusk
 - 3
 Private Whistler Sightseeing Tour: Discover all of Whistler in Comfort!
 - 4
 Whistler Helicopter Tour + Mountain Landing
 - 5
 Whistler Sightseeing Tour: Discover all of Whistler Year-Round!
 - 6
 Guided Fishing Adventure in Whistler
 - 7
 Whistler Helicopter Tour: Glaciers and Black Tusk
 - 8
 Whistler Distillery Tour & Tasting Experience
 - 9
 Whistler's Guided Axe Throwing Experience
 - 10
 Whistler Odyssey Tour: Off-Road Buggy Adventure
 - 11
 Superfly Ziplines on Cougar Mountain - Includes 4 Ziplines!
 - 12
 2 Hour Wilderness Adventure Snowmobile Tour in Whistler
 - 13
 Whistler Wilderness Run Snowmobile Tour
 - 14
 Whistler's Finer Things: 4-Course Dinner & Champagne Sabering
 - 15
 Scenic Valley Ride - E Bike Tour - Whistler Marmot Activity
 - 16
 Mountain Breeze Tour - Mountain E Bike - Whistler Marmot Activity
Last refreshed 2026-05-25.
Similar climatesVancouver88% · Portland82% · Seattle81%
Other destinations with the most-alike year-round climate to Whistler (apparent temperature, rain hours, sunshine — matched within the same trip-profile). The ±N chip compares each match's typical score for the current month against Whistler's. Based on the 2020-2024 climatology, not this year's actual weather.
Month-by-month
| Month | Temp °C | Feels °C | Rain days | Rain h | Rain h/day | Humidity | Wind km/h | Sun h | UV | Interest | Score |
|---|---|---|---|---|---|---|---|---|---|---|---|
| Jan | -3–2 | -1 | 22 | 378 | 17.2 | 80% | 7 | 66 | 1 | Moderate | 1 |
| Feb | -5–2 | -1 | 17 | 280 | 16.5 | 72% | 8 | 107 | 1 | Quiet | 2 |
| Mar | -3–5 | 2 | 17 | 280 | 16.5 | 65% | 8 | 166 | 2 | Quiet | 2 |
| Apr | -1–8 | 6 | 14 | 229 | 16.4 | 61% | 9 | 202 | 4 | Quiet | 4 |
| May | 4–15 | 13 | 13 | 210 | 16.2 | 61% | 9 | 248 | 5 | Quiet | 5 |
| Jun | 8–19 | 18 | 17 | 232 | 13.6 | 61% | 10 | 265 | 5 | Quiet | 6 |
| Jul | 12–24 | 24 | 7 | 91 | 13.0 | 52% | 10 | 317 | 6 | Quiet | 9 |
| Aug | 12–24 | 24 | 8 | 115 | 14.4 | 52% | 10 | 275 | 5 | Moderate | 9 |
| Sep | 9–19 | 19 | 11 | 168 | 15.3 | 61% | 9 | 209 | 4 | Quiet | 7 |
| Oct | 4–12 | 10 | 16 | 270 | 16.9 | 71% | 8 | 134 | 2 | Quiet | 4 |
| Nov | -2–4 | 2 | 19 | 310 | 16.3 | 77% | 8 | 82 | 1 | Peak | 1 |
| Dec | -4–2 | -1 | 21 | 333 | 15.9 | 78% | 7 | 69 | — | Peak | 1 |
UV Index in Whistler by Month
UV index in Whistler peaks at 6 (high) in July, dropping to 0 (low) in December. July have high UV — SPF 30+ and sunglasses recommended.
Best months in detail
July
9/1012–24°C · 7 rain days (91h) · 317 sun hours · 52% humidity · Quiet crowd · UV 6 (high) · sunniest 1 in 10 days reach 8 (very high)
August
9/1012–24°C · 8 rain days (115h) · 275 sun hours · 52% humidity · Moderate crowd · UV 5 (moderate) · sunniest 1 in 10 days reach 7 (high)
September
7/109–19°C · 11 rain days (168h) · 209 sun hours · 61% humidity · Quiet crowd · UV 4 (moderate) · sunniest 1 in 10 days reach 6 (moderate)
Every month
Show the other 9 months in detail
January
1/10-3–2°C (feels -1°C) · 22 rain days (378h) · 66 sun hours · 80% humidity · Moderate crowd · UV 1 (low)
February
2/10-5–2°C (feels -1°C) · 17 rain days (280h) · 107 sun hours · 72% humidity · Quiet crowd · UV 1 (low)
March
2/10-3–5°C (feels 2°C) · 17 rain days (280h) · 166 sun hours · 65% humidity · Quiet crowd · UV 2 (low) · sunniest 1 in 10 days reach 4 (moderate)
April
4/10-1–8°C (feels 6°C) · 14 rain days (229h) · 202 sun hours · 61% humidity · Quiet crowd · UV 4 (moderate) · sunniest 1 in 10 days reach 6 (high)
May
5/104–15°C (feels 13°C) · 13 rain days (210h) · 248 sun hours · 61% humidity · Quiet crowd · UV 5 (moderate) · sunniest 1 in 10 days reach 8 (very high)
June
6/108–19°C · 17 rain days (232h) · 265 sun hours · 61% humidity · Quiet crowd · UV 5 (moderate) · sunniest 1 in 10 days reach 8 (very high)
October
4/104–12°C (feels 10°C) · 16 rain days (270h) · 134 sun hours · 71% humidity · Quiet crowd · UV 2 (low) · sunniest 1 in 10 days reach 3 (moderate)
November
1/10-2–4°C (feels 2°C) · 19 rain days (310h) · 82 sun hours · 77% humidity · Peak crowd · UV 1 (low)
December
1/10-4–2°C (feels -1°C) · 21 rain days (333h) · 69 sun hours · 78% humidity · Peak crowd
Frequently asked questions about visiting Whistler
When is the best time to visit Whistler?
July is the highest-scoring month (9/10 on the Holiday Climate Index). Typical conditions: 12–24°C (7 rainy days). The top three months by score are July, August, September.
What is the worst time to visit Whistler?
December is the lowest-scoring month (1/10). Typical conditions: -4–2°C (21 rainy days).
When are crowds lowest in Whistler?
Search-interest seasonality (Google Trends 2021-2025) is lowest in April and peaks in December. Interest tracks both in-trip visitors and lead-time planners, so treat it as a "destination is on people's minds" signal rather than literal arrivals.
Which months in Whistler have good weather but fewer tourists?
July (climate 9/10, crowd index 20) and September (climate 7/10, crowd index 34) — shoulder months with above-average climate and below-median search-interest. Often the best value-for-weather trade.
What is the UV index in Whistler by month?
UV peaks at 6 (high) in July and is lowest in December at 0 (low). Monthly peak values: Jan 1, Feb 1, Mar 2, Apr 4, May 5, Jun 5, Jul 6, Aug 5, Sep 4, Oct 2, Nov 1, Dec —.
What is the UV index in Whistler in July?
July is the peak UV month in Whistler, with a daily-peak UV index of 6 (high). Apply SPF 30+, wear sunglasses, and seek shade during midday hours.
How high can UV get in Whistler on the sunniest days?
Most days look like the monthly average, but on the sunniest ~1 in 10 days UV climbs higher than the mean suggests. June is the worst case: typical days average UV 5 (moderate), but the top 10% of days reach UV 8 (very high) — and even higher. Months where the sunniest days routinely exceed the typical reading: March, April, May, June, July, August, September, October. Plan sun protection for the worst case, not the average.
Is air quality in Whistler bad for travelers?
PM2.5 (fine-particle pollution) exceeds the WHO sensitive-group guideline (15 µg/m³) in 1 month: August. The worst month is August with a typical-day mean of 8 µg/m³ (fair); on the worst 10% of days PM2.5 reaches 16 µg/m³ (unhealthy for sensitive) and higher. People with asthma, heart conditions, or sensitive children may want to avoid these months or limit outdoor activity. Source: CAMS via Open-Meteo.