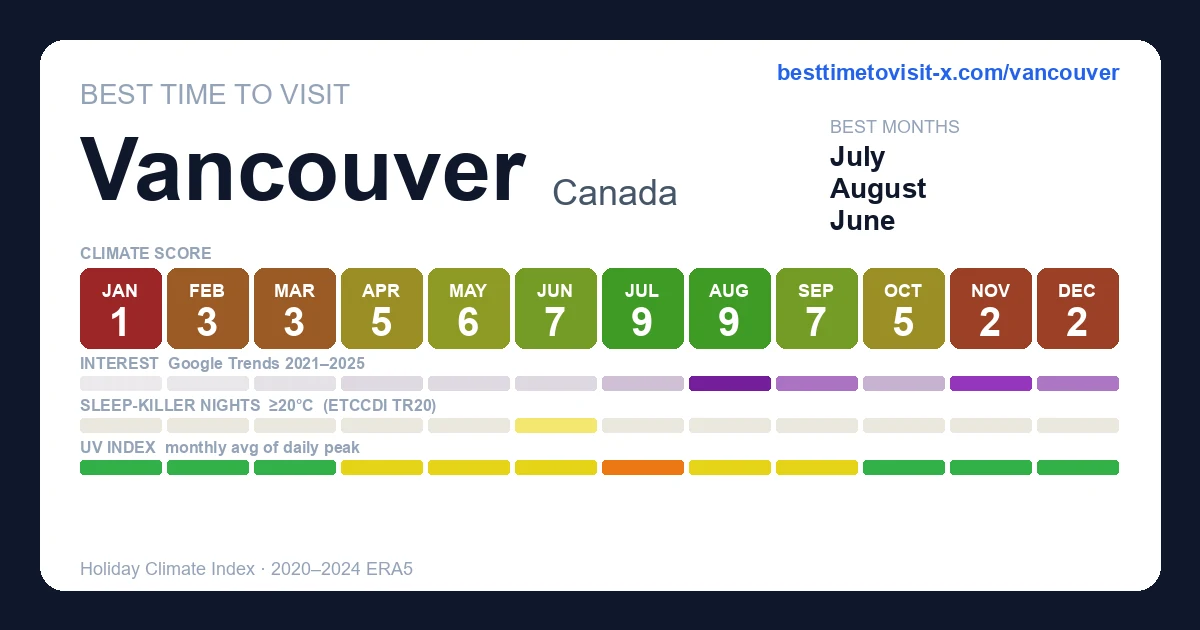
Best time to visit Vancouver
Re-score for me — drag the dial — every chart on the page recolours live for your heat limit 27°C
Default 27 °C is the upper edge of the Holiday Climate Index "ideal comfort" band (Scott, Rutty, Amelung & Tang, 2016). Above this, most warm-tourism travellers report measurable discomfort.
How is this scored? HCI / Steadman / CCI gate — full methodology and citations below.
Compare with another destination
Add as many as you like — stacked below the main strips above. Each row is just the recent-window score strip and (for beach destinations) sea-temperature strip.
Tours in Vancouver
26 top-rated tours via Viator. Booking links earn this site a commission at no cost to you. Map locations are approximate (centred on Vancouver).
- 1
 Vancouver Half-Day Whale Watching Adventure with Free Photos
 - 2
 Victoria & Butchart Gardens Tour with Ferry from Vancouver
 - 3
 Vancouver Whale Watch Tour with Guide
 - 4
 Vancouver Panorama Scenic Seaplane Tour
 - 5
 Whistler tour from Vancouver + Sea to Sky Gondola + Shannon Falls
 - 6
 Vancouver Grouse Mountain Express With Grouse Mountain Gondola
 - 7
 Vancouver Premium Tour: Capilano Bridge + Grouse Mountain Lunch
 - 8
 Vancouver Sailing Experience on a 50 foot Sailboat
 - 9
 Vancouver Stanley Park 3 Hour Bike Tour
 - 10
 UNESCO Biosphere and Bowen Island Boat Tour with Island Visit
 - 11
 Stanley Park & Vancouver City Highlights 4 Hour Bike Tour 2 in 1
 - 12
 Vancouver City Sightseeing Tour: Capilano Suspension Bridge & Vancouver Lookout
 - 13
 Post-cruise: Vancouver Tour with Lookout & Capilano Bridge
 - 14
 Granite Falls Zodiac Tour by Vancouver Water Adventures
 - 15
 Gastown Historic Walking Food Tour
 - 16
 Vancouver Foodie Tour: Granville Island Market Food Tour
 - 17
 Epic Electric Bike Tour by Cycle City Tours
 - 18
 Butchart Gardens and Victoria Sightseeing Tour from Vancouver
 - 19
 The Grand Bicycle Tour by Cycle City Tours
 - 20
 The Stanley Park Bicycle Tour by Cycle City Tours
 - 21
 A Wok Around Chinatown: Culinary and Cultural Walking Tour Led by a Chef
 - 22
 Vancouver Evening Dinner Cruise
 - 23
 Victoria and Butchart Gardens, an Elevated Experience
 - 24
 Whistler and Sea to Sky Gondola, a Fire and Ice Discovery Tour
 - 25
 Vancouver and Capilano Suspension Bridge, a Soft Adventure Tour
 - 26
 Vancouver Wine Tour (Fraser Valley)
Last refreshed 2026-05-25.
Similar climatesSeattle91% · Victoria89% · Portland89%
Other destinations with the most-alike year-round climate to Vancouver (apparent temperature, rain hours, sunshine — matched within the same trip-profile). The ±N chip compares each match's typical score for the current month against Vancouver's. Based on the 2020-2024 climatology, not this year's actual weather.
Month-by-month
| Month | Temp °C | Feels °C | Rain days | Rain h | Rain h/day | Humidity | Wind km/h | Sun h | UV | Interest | Score |
|---|---|---|---|---|---|---|---|---|---|---|---|
| Jan | 2–6 | 2 | 21 | 329 | 15.7 | 83% | 19 | 70 | 1 | Quiet | 1 |
| Feb | 1–6 | 3 | 16 | 215 | 13.4 | 78% | 18 | 107 | 1 | Quiet | 3 |
| Mar | 3–9 | 5 | 15 | 225 | 15.0 | 75% | 17 | 166 | 2 | Quiet | 3 |
| Apr | 5–11 | 8 | 13 | 180 | 13.8 | 69% | 18 | 201 | 3 | Quiet | 5 |
| May | 9–15 | 14 | 11 | 146 | 13.3 | 72% | 18 | 250 | 5 | Quiet | 6 |
| Jun | 12–19 | 18 | 12 | 141 | 11.8 | 70% | 17 | 269 | 6 | Quiet | 7 |
| Jul | 15–22 | 22 | 4 | 56 | 14.0 | 63% | 16 | 310 | 7 | Quiet | 9 |
| Aug | 15–22 | 22 | 6 | 72 | 12.0 | 66% | 17 | 278 | 5 | Peak | 9 |
| Sep | 13–19 | 18 | 10 | 125 | 12.5 | 73% | 16 | 211 | 4 | Moderate | 7 |
| Oct | 8–13 | 11 | 15 | 208 | 13.9 | 80% | 17 | 147 | 2 | Quiet | 5 |
| Nov | 4–8 | 5 | 19 | 264 | 13.9 | 82% | 19 | 85 | 1 | Busy | 2 |
| Dec | 2–6 | 2 | 21 | 293 | 14.0 | 85% | 18 | 69 | — | Moderate | 2 |
UV Index in Vancouver by Month
UV index in Vancouver peaks at 7 (high) in July, dropping to 0 (low) in December. July have high UV — SPF 30+ and sunglasses recommended.
Best months in detail
July
9/1015–22°C · 4 rain days (56h) · 310 sun hours · 63% humidity · Quiet crowd · UV 7 (high)
August
9/1015–22°C · 6 rain days (72h) · 278 sun hours · 66% humidity · Peak crowd · UV 5 (moderate) · sunniest 1 in 10 days reach 7 (high)
September
7/1013–19°C · 10 rain days (125h) · 211 sun hours · 73% humidity · Moderate crowd · UV 4 (moderate) · sunniest 1 in 10 days reach 5 (moderate)
Every month
Show the other 9 months in detail
January
1/102–6°C (feels 2°C) · 21 rain days (329h) · 70 sun hours · 83% humidity · Quiet crowd · UV 1 (low)
February
3/101–6°C (feels 3°C) · 16 rain days (215h) · 107 sun hours · 78% humidity · Quiet crowd · UV 1 (low)
March
3/103–9°C (feels 5°C) · 15 rain days (225h) · 166 sun hours · 75% humidity · Quiet crowd · UV 2 (low) · sunniest 1 in 10 days reach 3 (moderate)
April
5/105–11°C (feels 8°C) · 13 rain days (180h) · 201 sun hours · 69% humidity · Quiet crowd · UV 3 (moderate) · sunniest 1 in 10 days reach 5 (moderate)
May
6/109–15°C (feels 14°C) · 11 rain days (146h) · 250 sun hours · 72% humidity · Quiet crowd · UV 5 (moderate) · sunniest 1 in 10 days reach 7 (high)
June
7/1012–19°C (feels 18°C) · 12 rain days (141h) · 269 sun hours · 70% humidity · Quiet crowd · UV 6 (moderate) · sunniest 1 in 10 days reach 8 (high)
October
5/108–13°C (feels 11°C) · 15 rain days (208h) · 147 sun hours · 80% humidity · Quiet crowd · UV 2 (low) · sunniest 1 in 10 days reach 3 (moderate)
November
2/104–8°C (feels 5°C) · 19 rain days (264h) · 85 sun hours · 82% humidity · Busy crowd · UV 1 (low)
December
2/102–6°C (feels 2°C) · 21 rain days (293h) · 69 sun hours · 85% humidity · Moderate crowd
Comparisons people search for
Pairs validated by Google Autocomplete demand — only pairs people actually compare.
- Vancouver vs Victoria
- Vancouver vs Banff
- Vancouver vs Quebec City
- Vancouver vs San Diego
- Vancouver vs Las Vegas
- Vancouver vs Nashville
- Vancouver vs Montreal
- Vancouver vs Chicago
- Vancouver vs London
- Vancouver vs San Francisco
- Vancouver vs Honolulu
- Vancouver vs Tokyo
- Vancouver vs New York City
- Vancouver vs Dubai
- Vancouver vs Sydney
- Vancouver vs Paris
- Vancouver vs Edmonton
- Vancouver vs Glasgow
- Vancouver vs Edinburgh
Frequently asked questions about visiting Vancouver
When is the best time to visit Vancouver?
July is the highest-scoring month (9/10 on the Holiday Climate Index). Typical conditions: 15–22°C (4 rainy days). The top three months by score are July, August, September.
What is the worst time to visit Vancouver?
January is the lowest-scoring month (1/10). Typical conditions: 2–6°C (21 rainy days).
When are crowds lowest in Vancouver?
Search-interest seasonality (Google Trends 2021-2025) is lowest in January and peaks in August. Interest tracks both in-trip visitors and lead-time planners, so treat it as a "destination is on people's minds" signal rather than literal arrivals.
Which months in Vancouver have good weather but fewer tourists?
July (climate 9/10, crowd index 22) and June (climate 7/10, crowd index 10) — shoulder months with above-average climate and below-median search-interest. Often the best value-for-weather trade.
What is the UV index in Vancouver by month?
UV peaks at 7 (high) in July and is lowest in December at 0 (low). Monthly peak values: Jan 1, Feb 1, Mar 2, Apr 3, May 5, Jun 6, Jul 7, Aug 5, Sep 4, Oct 2, Nov 1, Dec —.
What is the UV index in Vancouver in July?
July is the peak UV month in Vancouver, with a daily-peak UV index of 7 (high). Apply SPF 30+, wear sunglasses, and seek shade during midday hours.
How high can UV get in Vancouver on the sunniest days?
Most days look like the monthly average, but on the sunniest ~1 in 10 days UV climbs higher than the mean suggests. June is the worst case: typical days average UV 6 (moderate), but the top 10% of days reach UV 8 (high) — and even higher. Months where the sunniest days routinely exceed the typical reading: March, April, May, June, August, September, October. Plan sun protection for the worst case, not the average.
Is air quality in Vancouver bad for travelers?
PM2.5 (fine-particle pollution) exceeds the WHO sensitive-group guideline (15 µg/m³) in 12 months: January, February, March, April, May, June, July, August, September, October, November, December. The worst month is August with a typical-day mean of 16 µg/m³ (unhealthy for sensitive); on the worst 10% of days PM2.5 reaches 28 µg/m³ (unhealthy) and higher. People with asthma, heart conditions, or sensitive children may want to avoid these months or limit outdoor activity. Source: CAMS via Open-Meteo.