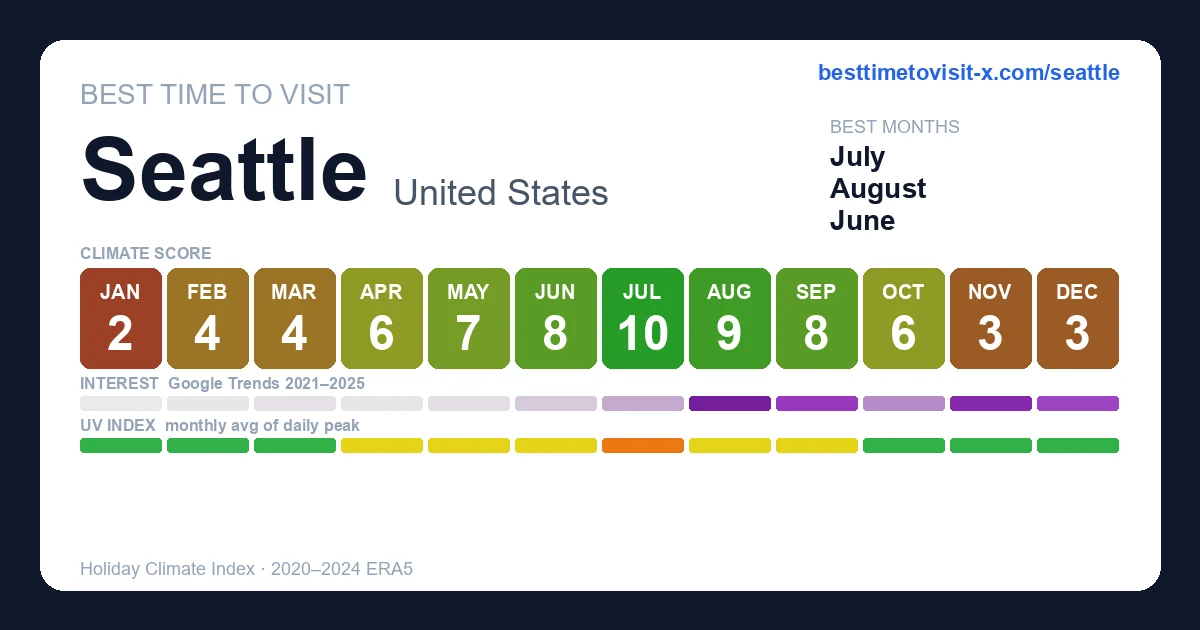
Best time to visit Seattle
Re-score for me — drag the dial — every chart on the page recolours live for your heat limit 27°C
Default 27 °C is the upper edge of the Holiday Climate Index "ideal comfort" band (Scott, Rutty, Amelung & Tang, 2016). Above this, most warm-tourism travellers report measurable discomfort.
How is this scored? HCI / Steadman / CCI gate — full methodology and citations below.
Compare with another destination
Add as many as you like — stacked below the main strips above. Each row is just the recent-window score strip and (for beach destinations) sea-temperature strip.
Tours in Seattle
23 top-rated tours via Viator. Booking links earn this site a commission at no cost to you. Map locations are approximate (centred on Seattle).
- 1
 Chef Guided Food Tour of Pike Place Market
 - 2
 Best of Olympic National Park from Seattle: All-Inclusive Small-Group Day Tour
 - 3
 Best of Mount Rainier National Park from Seattle: All-Inclusive Small-Group Tour
 - 4
 Seattle Private Tour for 2-5
 - 5
 Seattle's Original Sunset Sail (Est. 1984) - 70ft Boat - BYOB
 - 6
 Mt. St. Helens National Monument from Seattle: All-Inclusive Small-Group Tour
 - 7
 Bon Vivant Woodinville Wine Tasting Tour
 - 8
 Pike Place Market: Insider's Breakfast Tour - Gratuity Included!
 - 9
 Seattle’s Original Sailing Cruise (Est. 1984) – 70ft Boat - BYOB
 - 10
 Mt. Rainier National Park Highlights Tour
 - 11
 Mt. Rainier Day Tour from Seattle
 - 12
 Evening Colors Sunset Sail Tour in Seattle
 - 13
 Guided hike on Mt. Rainier - old forest, falls and glacier views
 - 14
 Seattle City and Snoqualmie Falls Half-Day Guided Tour
 - 15
 Mt Rainier National Park Full Day In-Depth Tour from Seattle
 - 16
 Pike Place Market: Original Food Tour - Tips Included!
 - 17
 Seattle City Tour
 - 18
 Pike Place Market Tasting Tour
 - 19
 Seattle Coffee Tour: Capitol Hill Coffee Culture & Tastings
 - 20Early-Bird Tasting Tour of Pike Place Market
- 21
 Haunted Seattle Booze and Boos Ghost Walking Tour
 - 22
 Seattle Delicious Donut Adventure & Walking Food Tour
 - 23
 Yellowstone Grand Teton and Coeur d’Alene 5-Day Tour from Seattle
Last refreshed 2026-05-30.
Similar climatesVictoria93% · Vancouver91% · Portland91%
Other destinations with the most-alike year-round climate to Seattle (apparent temperature, rain hours, sunshine — matched within the same trip-profile). The ±N chip compares each match's typical score for the current month against Seattle's. Based on the 2020-2024 climatology, not this year's actual weather.
Month-by-month
| Month | Temp °C | Feels °C | Rain days | Rain h | Rain h/day | Humidity | Wind km/h | Sun h | UV | Interest | Score |
|---|---|---|---|---|---|---|---|---|---|---|---|
| Jan | 3–8 | 5 | 20 | 281 | 14.1 | 82% | 21 | 85 | 1 | Quiet | 2 |
| Feb | 3–8 | 4 | 14 | 203 | 14.5 | 77% | 21 | 105 | 1 | Quiet | 4 |
| Mar | 4–10 | 7 | 14 | 186 | 13.3 | 73% | 20 | 169 | 2 | Quiet | 4 |
| Apr | 5–13 | 10 | 13 | 147 | 11.3 | 65% | 21 | 205 | 4 | Quiet | 6 |
| May | 9–17 | 15 | 12 | 139 | 11.6 | 65% | 19 | 227 | 5 | Quiet | 7 |
| Jun | 12–21 | 19 | 9 | 123 | 13.7 | 62% | 19 | 252 | 6 | Quiet | 8 |
| Jul | 15–25 | 24 | 2 | 36 | 18.0 | 54% | 18 | 297 | 7 | Quiet | 10 |
| Aug | 15–25 | 24 | 6 | 58 | 9.7 | 57% | 18 | 263 | 6 | Peak | 9 |
| Sep | 13–21 | 20 | 8 | 98 | 12.3 | 64% | 18 | 206 | 4 | Busy | 8 |
| Oct | 9–15 | 13 | 13 | 157 | 12.1 | 74% | 19 | 148 | 2 | Moderate | 6 |
| Nov | 5–10 | 7 | 18 | 220 | 12.2 | 79% | 22 | 101 | 1 | Peak | 3 |
| Dec | 3–8 | 4 | 20 | 249 | 12.4 | 82% | 22 | 78 | 1 | Busy | 3 |
UV Index in Seattle by Month
UV index in Seattle peaks at 7 (high) in July, dropping to 1 (low) in December. July have high UV — SPF 30+ and sunglasses recommended.
Best months in detail
July
10/1015–25°C · 2 rain days (36h) · 297 sun hours · 54% humidity · Quiet crowd · UV 7 (high) · sunniest 1 in 10 days reach 8 (very high)
August
9/1015–25°C · 6 rain days (58h) · 263 sun hours · 57% humidity · Peak crowd · UV 6 (moderate) · sunniest 1 in 10 days reach 8 (high)
September
8/1013–21°C · 8 rain days (98h) · 206 sun hours · 64% humidity · Busy crowd · UV 4 (moderate)
Every month
Show the other 9 months in detail
January
2/103–8°C (feels 5°C) · 20 rain days (281h) · 85 sun hours · 82% humidity · Quiet crowd · UV 1 (low)
February
4/103–8°C (feels 4°C) · 14 rain days (203h) · 105 sun hours · 77% humidity · Quiet crowd · UV 1 (low)
March
4/104–10°C (feels 7°C) · 14 rain days (186h) · 169 sun hours · 73% humidity · Quiet crowd · UV 2 (low) · sunniest 1 in 10 days reach 3 (moderate)
April
6/105–13°C (feels 10°C) · 13 rain days (147h) · 205 sun hours · 65% humidity · Quiet crowd · UV 4 (moderate) · sunniest 1 in 10 days reach 5 (moderate)
May
7/109–17°C (feels 15°C) · 12 rain days (139h) · 227 sun hours · 65% humidity · Quiet crowd · UV 5 (moderate) · sunniest 1 in 10 days reach 7 (high)
June
8/1012–21°C (feels 19°C) · 9 rain days (123h) · 252 sun hours · 62% humidity · Quiet crowd · UV 6 (moderate) · sunniest 1 in 10 days reach 8 (high)
October
6/109–15°C (feels 13°C) · 13 rain days (157h) · 148 sun hours · 74% humidity · Moderate crowd · UV 2 (low) · sunniest 1 in 10 days reach 4 (moderate)
November
3/105–10°C (feels 7°C) · 18 rain days (220h) · 101 sun hours · 79% humidity · Peak crowd · UV 1 (low)
December
3/103–8°C (feels 4°C) · 20 rain days (249h) · 78 sun hours · 82% humidity · Busy crowd · UV 1 (low)
Frequently asked questions about visiting Seattle
When is the best time to visit Seattle?
July is the highest-scoring month (10/10 on the Holiday Climate Index). Typical conditions: 15–25°C (2 rainy days). The top three months by score are July, August, September.
What is the worst time to visit Seattle?
January is the lowest-scoring month (2/10). Typical conditions: 3–8°C (20 rainy days).
When are crowds lowest in Seattle?
Search-interest seasonality (Google Trends 2021-2025) is lowest in January and peaks in August. Interest tracks both in-trip visitors and lead-time planners, so treat it as a "destination is on people's minds" signal rather than literal arrivals.
Which months in Seattle have good weather but fewer tourists?
July (climate 10/10, crowd index 32) and June (climate 8/10, crowd index 17) — shoulder months with above-average climate and below-median search-interest. Often the best value-for-weather trade.
What is the UV index in Seattle by month?
UV peaks at 7 (high) in July and is lowest in December at 1 (low). Monthly peak values: Jan 1, Feb 1, Mar 2, Apr 4, May 5, Jun 6, Jul 7, Aug 6, Sep 4, Oct 2, Nov 1, Dec 1.
What is the UV index in Seattle in July?
July is the peak UV month in Seattle, with a daily-peak UV index of 7 (high). Apply SPF 30+, wear sunglasses, and seek shade during midday hours.
How high can UV get in Seattle on the sunniest days?
Most days look like the monthly average, but on the sunniest ~1 in 10 days UV climbs higher than the mean suggests. July is the worst case: typical days average UV 7 (high), but the top 10% of days reach UV 8 (very high) — and even higher. Months where the sunniest days routinely exceed the typical reading: March, April, May, June, July, August, October. Plan sun protection for the worst case, not the average.
Is air quality in Seattle bad for travelers?
PM2.5 (fine-particle pollution) exceeds the WHO sensitive-group guideline (15 µg/m³) in 8 months: January, February, March, August, September, October, November, December. The worst month is August with a typical-day mean of 12 µg/m³ (moderate); on the worst 10% of days PM2.5 reaches 20 µg/m³ (unhealthy for sensitive) and higher. People with asthma, heart conditions, or sensitive children may want to avoid these months or limit outdoor activity. Source: CAMS via Open-Meteo.