Best time to visit Uluru
Re-score for me — drag the dial — every chart on the page recolours live for your heat limit 27°C
Default 27 °C is the upper edge of the Holiday Climate Index "ideal comfort" band (Scott, Rutty, Amelung & Tang, 2016). Above this, most warm-tourism travellers report measurable discomfort.
Greyed factors are scored normally — extreme heat overrides them, so a clear sky or low rain can't lift the period.
Greyed factors are scored normally — extreme heat overrides them, so a clear sky or low rain can't lift the period.
Greyed factors are scored normally — extreme heat overrides them, so a clear sky or low rain can't lift the period.
Greyed factors are scored normally — extreme heat overrides them, so a clear sky or low rain can't lift the period.
Greyed factors are scored normally — extreme heat overrides them, so a clear sky or low rain can't lift the period.
Greyed factors are scored normally — extreme heat overrides them, so a clear sky or low rain can't lift the period.
Greyed factors are scored normally — extreme heat overrides them, so a clear sky or low rain can't lift the period.
Greyed factors are scored normally — extreme heat overrides them, so a clear sky or low rain can't lift the period.
Greyed factors are scored normally — extreme heat overrides them, so a clear sky or low rain can't lift the period.
Greyed factors are scored normally — extreme heat overrides them, so a clear sky or low rain can't lift the period.
Greyed factors are scored normally — extreme heat overrides them, so a clear sky or low rain can't lift the period.
Greyed factors are scored normally — extreme heat overrides them, so a clear sky or low rain can't lift the period.
Greyed factors are scored normally — extreme heat overrides them, so a clear sky or low rain can't lift the period.
Greyed factors are scored normally — extreme heat overrides them, so a clear sky or low rain can't lift the period.
Greyed factors are scored normally — extreme heat overrides them, so a clear sky or low rain can't lift the period.
Greyed factors are scored normally — extreme heat overrides them, so a clear sky or low rain can't lift the period.
Greyed factors are scored normally — extreme heat overrides them, so a clear sky or low rain can't lift the period.
Greyed factors are scored normally — extreme heat overrides them, so a clear sky or low rain can't lift the period.
Greyed factors are scored normally — extreme heat overrides them, so a clear sky or low rain can't lift the period.
Greyed factors are scored normally — extreme heat overrides them, so a clear sky or low rain can't lift the period.
Greyed factors are scored normally — extreme heat overrides them, so a clear sky or low rain can't lift the period.
Greyed factors are scored normally — extreme heat overrides them, so a clear sky or low rain can't lift the period.
Greyed factors are scored normally — extreme heat overrides them, so a clear sky or low rain can't lift the period.
Greyed factors are scored normally — extreme heat overrides them, so a clear sky or low rain can't lift the period.
How is this scored? HCI / Steadman / CCI gate — full methodology and citations below.
Compare with another destination
Add as many as you like — stacked below the main strips above. Each row is just the recent-window score strip and (for beach destinations) sea-temperature strip.
Tours in Uluru
12 top-rated tours via Viator. Booking links earn this site a commission at no cost to you. Map locations are approximate (centred on Uluru).
- 1
 25-Minute Uluru and Kata Tjuta Scenic Helicopter Flight
 - 2
 Early Morning Ballooning in Alice Springs
 - 3
 Scenic Plane Flight: Uluru & Kata Tjuta
 - 4
 Uluru Private Tour Aboriginal guided option
 - 5
 Kata Tjuta Valley of the Winds Circuit Hike
 - 6
 Ayers Rock and Kata Tjuta 1-Hour Scenic Flight: Lizard Safari
 - 7
 15-Minute Uluru & Resort Postcard Helicopter Flight
 - 8
 Full Uluru Base Walk at Sunrise Including breakfast
 - 9
 Highlights of Uluru Including Sunrise and Breakfast
 - 10
 Mt Conner 4WD Small Group Tour from Ayers Rock Resort inc Dinner
 - 11
 Aboriginal Homelands Experience
 - 12
 Sunrise Uluru Private Tour
Last refreshed 2026-06-22.
Similar climatesYulara96% · Alice Springs94% · Mendoza89%
Other destinations with the most-alike year-round climate to Uluru (apparent temperature, rain hours, sunshine — matched within the same trip-profile). The ±N chip compares each match's typical score for the current month against Uluru's. Based on the 2020-2024 climatology, not this year's actual weather.
Month-by-month
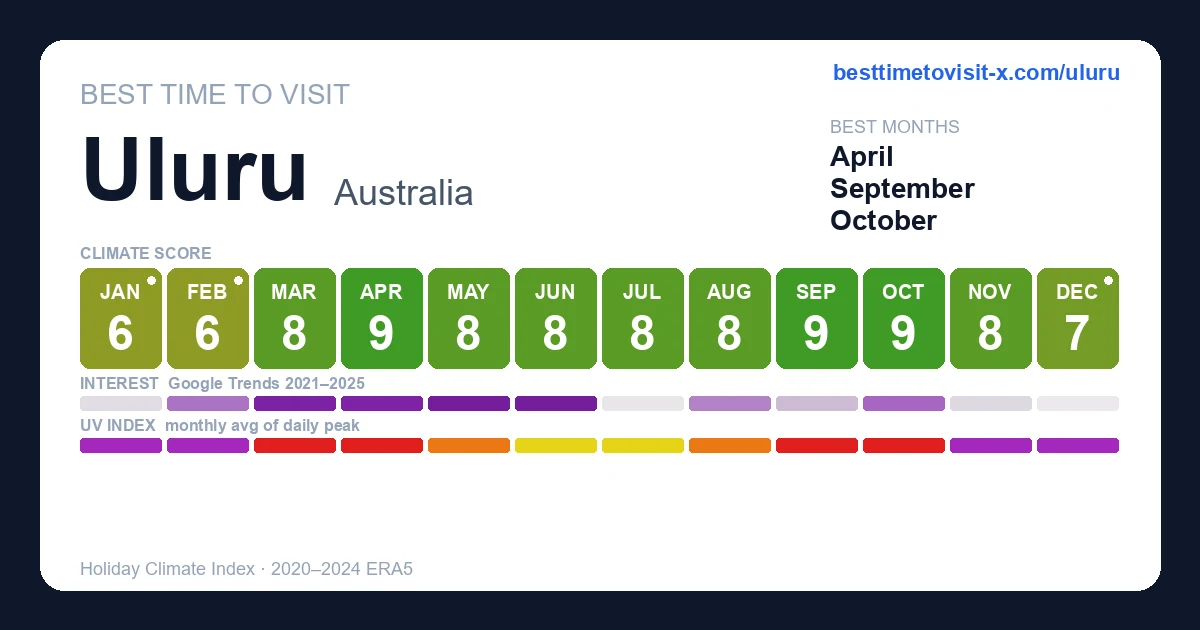
| Month | Temp °C | Feels °C | Rain days | Rain h | Rain h/day | Humidity | Wind km/h | Sun h | UV | Interest | Score |
|---|---|---|---|---|---|---|---|---|---|---|---|
| Jan | 22–34 | 32 | 6 | 68 | 11.3 | 28% | 30 | 257 | 14 | Quiet | 6 |
| Feb | 21–34 | 31 | 2 | 21 | 10.5 | 21% | 27 | 258 | 13 | Quiet | 6 |
| Mar | 20–32 | 29 | 3 | 37 | 12.3 | 25% | 26 | 242 | 10 | Busy | 8 |
| Apr | 14–27 | 23 | 1 | 10 | 10.0 | 25% | 24 | 234 | 9 | Moderate | 9 |
| May | 9–21 | 17 | 2 | 18 | 9.0 | 29% | 22 | 223 | 6 | Peak | 8 |
| Jun | 5–18 | 14 | 3 | 32 | 10.7 | 37% | 20 | 209 | 5 | Busy | 8 |
| Jul | 5–18 | 14 | 0 | 6 | — | 31% | 22 | 237 | 5 | Moderate | 8 |
| Aug | 8–23 | 18 | 1 | 14 | 14.0 | 23% | 23 | 245 | 7 | Busy | 8 |
| Sep | 12–26 | 21 | 3 | 29 | 9.7 | 21% | 27 | 241 | 9 | Busy | 9 |
| Oct | 15–30 | 25 | 4 | 33 | 8.3 | 21% | 29 | 257 | 11 | Moderate | 9 |
| Nov | 18–31 | 28 | 5 | 45 | 9.0 | 26% | 28 | 257 | 12 | Quiet | 8 |
| Dec | 20–34 | 31 | 4 | 37 | 9.3 | 23% | 27 | 269 | 13 | Quiet | 7 |
UV Index in Uluru by Month
UV index in Uluru peaks at 14 (extreme) in January, dropping to 5 (moderate) in June. January, February, March, April, September, October, November, December reach very high or extreme levels — apply SPF 50+, wear a hat and protective clothing, and limit direct sun between 11:00 and 17:00.
Best months in detail
April
9/1014–27°C (feels 23°C) · 1 rain days (10h) · 234 sun hours · 25% humidity · Moderate crowd · UV 9 (very high) · sunniest 1 in 10 days reach 10 (very high)
September
9/1012–26°C (feels 21°C) · 3 rain days (29h) · 241 sun hours · 21% humidity · Busy crowd · UV 9 (very high) · sunniest 1 in 10 days reach 10 (very high)
October
9/1015–30°C (feels 25°C) · 4 rain days (33h) · 257 sun hours · 21% humidity · Moderate crowd · UV 11 (very high) · sunniest 1 in 10 days reach 12 (extreme)
Every month
Show the other 9 months in detail
January
6/1022–34°C (feels 32°C) · 6 rain days (68h) · 257 sun hours · 28% humidity · Quiet crowd · UV 14 (extreme) · sunniest 1 in 10 days reach 16 (extreme)
February
6/1021–34°C (feels 31°C) · 2 rain days (21h) · 258 sun hours · 21% humidity · Quiet crowd · UV 13 (extreme) · sunniest 1 in 10 days reach 15 (extreme)
March
8/1020–32°C (feels 29°C) · 3 rain days (37h) · 242 sun hours · 25% humidity · Busy crowd · UV 10 (very high) · sunniest 1 in 10 days reach 13 (extreme)
May
8/109–21°C (feels 17°C) · 2 rain days (18h) · 223 sun hours · 29% humidity · Peak crowd · UV 6 (high)
June
8/105–18°C (feels 14°C) · 3 rain days (32h) · 209 sun hours · 37% humidity · Busy crowd · UV 5 (moderate)
July
8/105–18°C (feels 14°C) · 0 rain days (6h) · 237 sun hours · 31% humidity · Moderate crowd · UV 5 (moderate)
August
8/108–23°C (feels 18°C) · 1 rain days (14h) · 245 sun hours · 23% humidity · Busy crowd · UV 7 (high) · sunniest 1 in 10 days reach 8 (very high)
November
8/1018–31°C (feels 28°C) · 5 rain days (45h) · 257 sun hours · 26% humidity · Quiet crowd · UV 12 (extreme) · sunniest 1 in 10 days reach 14 (extreme)
December
7/1020–34°C (feels 31°C) · 4 rain days (37h) · 269 sun hours · 23% humidity · Quiet crowd · UV 13 (extreme) · sunniest 1 in 10 days reach 15 (extreme)
Above 36C the walk itself gets shorter
Uluru does not merely get hot in summer. The walks contract, on a published numeric trigger.
When the forecast or actual temperature reaches 36C, the Valley of the Winds walk closes at the first lookout from 11am — turning a 7.4 km circuit into a 2.2 km return stub and removing the Karingana lookout leg entirely. At 40C the north-east walk closes for the whole day, which severs the 10.6 km Uluru base circuit rather than shortening it.
The park publishes Yulara's average daily maximum as 38.4C in January, 37.0C in February and 36.5C in December. So on an average summer day the 36C trigger is already met: a December visitor is not getting a hot version of the walk, they are getting a fifth of it. The park's own recommendation is May to September, when daytime maxima usually sit between 20C and 30C.
Sources: Uluru-Kata Tjuta National Park — Valley of the Winds walk, closure thresholds , Uluru-Kata Tjuta National Park — opening hours by month
Do walks close because of heat at Uluru?
Two do, on published thresholds. The Valley of the Winds walk closes at the first lookout from 11am when the forecast or actual temperature reaches 36C, and the north-east walk closes for the day from 11am at 40C. Other walks carry no stated threshold and close on ranger judgement instead.
How long is the Valley of the Winds walk?
The full circuit is 7.4 km and takes three to four hours, graded difficult with steep rocky sections. When the 36C trigger is met it is cut to the Karu Lookout return of 2.2 km, about an hour, and the 5.4 km Karingana Lookout option disappears too. In summer that truncation is the norm rather than the exception.
When is the best time to visit Uluru?
May to September, which is the park's own recommendation — daytime maxima usually sit between 20C and 30C and the heat triggers rarely fire. August and September add wildflowers. December through February average above the 36C threshold, so the long walks are routinely shortened.
What are the opening hours at Uluru?
They shift monthly with sunrise and sunset. The park opens at 5am and closes at 9pm in December, January and February — sixteen hours — against 6.30am to 7.30pm in June and July, which is thirteen. The Cultural Centre keeps fixed hours of 7am to 5.45pm daily, and visitors must be outside the park by closing.
Can you climb Uluru?
No. The climb closed permanently on 26 October 2019, the thirty-fourth anniversary of the park's handback to Anangu. The board of management voted unanimously to close it in 2017, one agreed criterion being that the proportion of visitors climbing had fallen below 20%. Climbing is now an offence under federal environment law.
How much does it cost to enter Uluru-Kata Tjuta National Park?
Thirty-eight dollars for an adult, valid three days, or fifty dollars for an annual pass. Children and teenagers under eighteen enter free. Northern Territory residents can buy a vehicle annual pass covering driver and passengers. The pass covers this park only — Kakadu requires a separate one.
Can you take photos at Uluru?
In most places yes, but there are specific restrictions at culturally sensitive sites. The Valley of the Winds is a men's area where visitors are asked not to photograph the rock formations at all, and the north-east face of Uluru should only be shot wide from a distance. Drones are prohibited park-wide under federal law.
How many days do you need at Uluru?
Three, which conveniently matches the pass validity. One for the Uluru base walk and the Cultural Centre, one for Kata Tjuta and the Valley of the Winds, and one for sunrise and sunset viewing plus the free ranger-guided Mala walk. In summer, spread the same itinerary across more mornings.
When is the ranger-guided Mala walk?
Free daily, at 8am from October to April and 10am from May to September — earlier in summer rather than later, because of the heat. It is an easy two-kilometre return walk, wheelchair accessible, finishing at Kantju Gorge. No booking is needed; you meet at the Mala car park.
What are the seasons at Uluru?
Anangu recognise five, not four, and they map the desert year far better than a four-season model: a rain period when plants flower, a cooling period when reptiles go dormant, a cold period of frost and almost no rain, a warm windy period when animals breed, and the hottest period when food is scarce. The park notes these are what Anangu go by rather than calendar dates.
Frequently asked questions about visiting Uluru
When is the best time to visit Uluru?
April is the highest-scoring month (9/10 on the Holiday Climate Index). Typical conditions: 14–27°C (1 rainy day). The top three months by score are April, September, October.
What is the worst time to visit Uluru?
January is the lowest-scoring month (6/10, capped by extreme heat). Typical conditions: 22–34°C (6 rainy days).
Is Uluru too hot in summer?
3 months (January, February, December) trip the heat deal-breaker in our scoring: apparent temperature crosses the comfort cap, so even with clear skies and low rain the score is held down. Plan around it if heat tolerance is low.
When are crowds lowest in Uluru?
Search-interest seasonality (Google Trends 2021-2025) is lowest in December and peaks in May. Interest tracks both in-trip visitors and lead-time planners, so treat it as a "destination is on people's minds" signal rather than literal arrivals.
Which months in Uluru have good weather but fewer tourists?
October (climate 9/10, crowd index 49) and November (climate 8/10, crowd index 31) — shoulder months with above-average climate and below-median search-interest. Often the best value-for-weather trade.
What is the UV index in Uluru by month?
UV peaks at 14 (extreme) in January and is lowest in June at 5 (moderate). Monthly peak values: Jan 14, Feb 13, Mar 10, Apr 9, May 6, Jun 5, Jul 5, Aug 7, Sep 9, Oct 11, Nov 12, Dec 13. January, February, March, April, September, October, November, December reach very high or extreme levels — apply SPF 50+, wear a hat and protective clothing, and limit direct sun between 11:00 and 17:00.
What is the UV index in Uluru in January?
January is the peak UV month in Uluru, with a daily-peak UV index of 14 (extreme). At this level, sunburn can occur in under 20 minutes on unprotected fair skin. Apply SPF 50+, wear protective clothing and a hat, and avoid direct midday sun (11:00–17:00).
How high can UV get in Uluru on the sunniest days?
Most days look like the monthly average, but on the sunniest ~1 in 10 days UV climbs higher than the mean suggests. January is the worst case: typical days average UV 14 (extreme), but the top 10% of days reach UV 16 (extreme) — and even higher. Months where the sunniest days routinely exceed the typical reading: January, February, March, April, August, September, October, November, December. Plan sun protection for the worst case, not the average.