Best time to visit San Pedro de Atacama
Re-score for me — drag the dial — every chart on the page recolours live for your heat limit 27°C
Default 27 °C is the upper edge of the Holiday Climate Index "ideal comfort" band (Scott, Rutty, Amelung & Tang, 2016). Above this, most warm-tourism travellers report measurable discomfort.
How is this scored? HCI / Steadman / CCI gate — full methodology and citations below.
Compare with another destination
Add as many as you like — stacked below the main strips above. Each row is just the recent-window score strip and (for beach destinations) sea-temperature strip.
Tours in San Pedro de Atacama
11 top-rated tours via Viator. Booking links earn this site a commission at no cost to you. Map locations are approximate (centred on San Pedro de Atacama).
- 1
 Full Day Tour to Piedras Rojas, Altiplanic Lagoons and Chaxa
 - 2
 Tour to the Hidden Lagoons of Baltinache
 - 3
 San Pedro de Atacama Cejar Lagoon
 - 4
 Full 3-Day Tour in San Pedro de Atacama
 - 5
 Moon & Death Valley in San Pedro de Atacama
 - 6
 Tour to Vallecito and Magic Bus
 - 7
 Full Day Tour to Ruta de los Salares
 - 8
 The Roofless Experience San Pedro de Atacama Stargazing Tour
 - 9
 Half Day Tour to Geysers del Tatio
 - 10
 Aire Libre - Astro Tour with big telescopes
 - 11
 Bike Tour in San Pedro de Atacama - Devil's Throat
Last refreshed 2026-06-15.
Similar climatesMendoza85% · Yulara84% · Alice Springs83%
Other destinations with the most-alike year-round climate to San Pedro de Atacama (apparent temperature, rain hours, sunshine — matched within the same trip-profile). The ±N chip compares each match's typical score for the current month against San Pedro de Atacama's. Based on the 2020-2024 climatology, not this year's actual weather.
Month-by-month
| Month | Temp °C | Feels °C | Rain days | Rain h | Rain h/day | Humidity | Wind km/h | Sun h | UV | Interest | Score |
|---|---|---|---|---|---|---|---|---|---|---|---|
| Jan | 12–28 | 23 | 4 | 25 | 6.3 | 19% | 27 | 289 | 17 | Quiet | 8 |
| Feb | 12–28 | 23 | 3 | 17 | 5.7 | 20% | 27 | 260 | 15 | Quiet | 9 |
| Mar | 12–27 | 23 | 3 | 13 | 4.3 | 21% | 23 | 271 | 14 | Quiet | 9 |
| Apr | 8–25 | 20 | 0 | 1 | — | 13% | 19 | 249 | 11 | Quiet | 8 |
| May | 5–22 | 16 | 1 | 6 | 6.0 | 12% | 18 | 248 | 8 | Quiet | 8 |
| Jun | 3–19 | 13 | 1 | 7 | 7.0 | 13% | 18 | 235 | 6 | Quiet | 7 |
| Jul | 3–19 | 14 | 0 | 1 | — | 8% | 19 | 245 | 7 | Quiet | 7 |
| Aug | 3–21 | 15 | 0 | 6 | — | 9% | 20 | 253 | 9 | Peak | 8 |
| Sep | 5–24 | 18 | 0 | 1 | — | 6% | 22 | 260 | 12 | Moderate | 8 |
| Oct | 8–26 | 20 | 0 | 2 | — | 7% | 25 | 289 | 15 | Moderate | 8 |
| Nov | 10–28 | 22 | 0 | 1 | — | 8% | 27 | 288 | 16 | Peak | 8 |
| Dec | 11–28 | 23 | 1 | 15 | 15.0 | 13% | 29 | 294 | 16 | Busy | 8 |
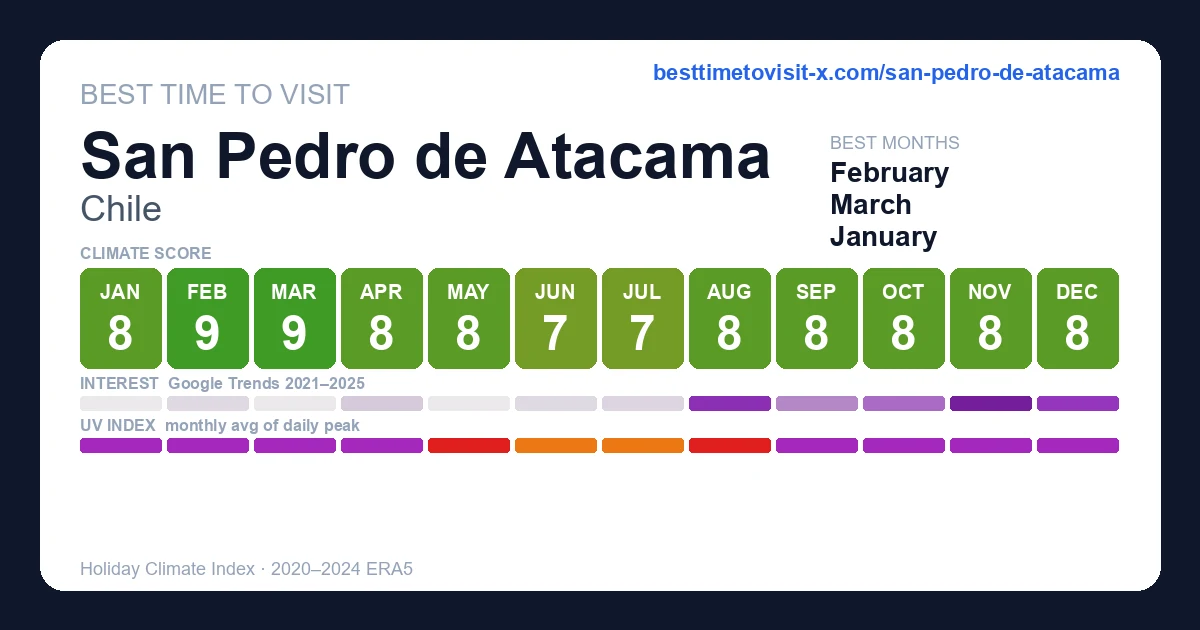
UV Index in San Pedro de Atacama by Month
UV index in San Pedro de Atacama peaks at 17 (extreme) in January, dropping to 6 (high) in June. January, February, March, April, May, August, September, October, November, December reach very high or extreme levels — apply SPF 50+, wear a hat and protective clothing, and limit direct sun between 11:00 and 17:00.
Best months in detail
March
9/1012–27°C (feels 23°C) · 3 rain days (13h) · 271 sun hours · 21% humidity · Quiet crowd · UV 14 (extreme)
February
9/1012–28°C (feels 23°C) · 3 rain days (17h) · 260 sun hours · 20% humidity · Quiet crowd · UV 15 (extreme) · sunniest 1 in 10 days reach 17 (extreme)
January
8/1012–28°C (feels 23°C) · 4 rain days (25h) · 289 sun hours · 19% humidity · Quiet crowd · UV 17 (extreme)
Every month
Show the other 9 months in detail
April
8/108–25°C (feels 20°C) · 0 rain days (1h) · 249 sun hours · 13% humidity · Quiet crowd · UV 11 (extreme)
May
8/105–22°C (feels 16°C) · 1 rain days (6h) · 248 sun hours · 12% humidity · Quiet crowd · UV 8 (very high)
June
7/103–19°C (feels 13°C) · 1 rain days (7h) · 235 sun hours · 13% humidity · Quiet crowd · UV 6 (high)
July
7/103–19°C (feels 14°C) · 0 rain days (1h) · 245 sun hours · 8% humidity · Quiet crowd · UV 7 (high)
August
8/103–21°C (feels 15°C) · 0 rain days (6h) · 253 sun hours · 9% humidity · Peak crowd · UV 9 (very high)
September
8/105–24°C (feels 18°C) · 0 rain days (1h) · 260 sun hours · 6% humidity · Moderate crowd · UV 12 (extreme) · sunniest 1 in 10 days reach 14 (extreme)
October
8/108–26°C (feels 20°C) · 0 rain days (2h) · 289 sun hours · 7% humidity · Moderate crowd · UV 15 (extreme)
November
8/1010–28°C (feels 22°C) · 0 rain days (1h) · 288 sun hours · 8% humidity · Peak crowd · UV 16 (extreme)
December
8/1011–28°C (feels 23°C) · 1 rain days (15h) · 294 sun hours · 13% humidity · Busy crowd · UV 16 (extreme)
Frequently asked questions about visiting San Pedro de Atacama
When is the best time to visit San Pedro de Atacama?
March is the highest-scoring month (9/10 on the Holiday Climate Index). Typical conditions: 12–27°C (3 rainy days). The top three months by score are March, February, January.
What is the worst time to visit San Pedro de Atacama?
July is the lowest-scoring month (7/10). Typical conditions: 3–19°C (0 rainy days).
When are crowds lowest in San Pedro de Atacama?
Search-interest seasonality (Google Trends 2021-2025) is lowest in January and peaks in November. Interest tracks both in-trip visitors and lead-time planners, so treat it as a "destination is on people's minds" signal rather than literal arrivals.
Which months in San Pedro de Atacama have good weather but fewer tourists?
February (climate 9/10, crowd index 9) and March (climate 9/10, crowd index 0) — shoulder months with above-average climate and below-median search-interest. Often the best value-for-weather trade.
What is the UV index in San Pedro de Atacama by month?
UV peaks at 17 (extreme) in January and is lowest in June at 6 (high). Monthly peak values: Jan 17, Feb 15, Mar 14, Apr 11, May 8, Jun 6, Jul 7, Aug 9, Sep 12, Oct 15, Nov 16, Dec 16. January, February, March, April, May, August, September, October, November, December reach very high or extreme levels — apply SPF 50+, wear a hat and protective clothing, and limit direct sun between 11:00 and 17:00.
What is the UV index in San Pedro de Atacama in January?
January is the peak UV month in San Pedro de Atacama, with a daily-peak UV index of 17 (extreme). At this level, sunburn can occur in under 20 minutes on unprotected fair skin. Apply SPF 50+, wear protective clothing and a hat, and avoid direct midday sun (11:00–17:00).
How high can UV get in San Pedro de Atacama on the sunniest days?
Most days look like the monthly average, but on the sunniest ~1 in 10 days UV climbs higher than the mean suggests. February is the worst case: typical days average UV 15 (extreme), but the top 10% of days reach UV 17 (extreme) — and even higher. Months where the sunniest days routinely exceed the typical reading: February, September. Plan sun protection for the worst case, not the average.
Is air quality in San Pedro de Atacama bad for travelers?
PM2.5 (fine-particle pollution) exceeds the WHO sensitive-group guideline (15 µg/m³) in 1 month: July. The worst month is July with a typical-day mean of 12 µg/m³ (moderate); on the worst 10% of days PM2.5 reaches 21 µg/m³ (unhealthy for sensitive) and higher. People with asthma, heart conditions, or sensitive children may want to avoid these months or limit outdoor activity. Source: CAMS via Open-Meteo.