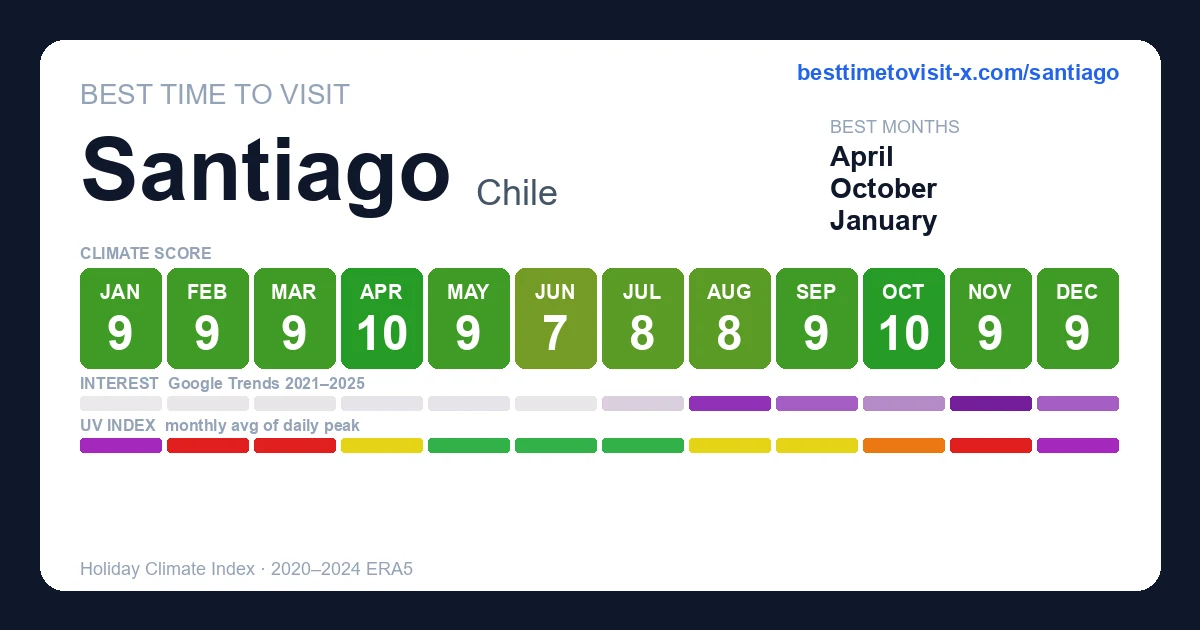
Best time to visit Santiago
Re-score for me — drag the dial — every chart on the page recolours live for your heat limit 27°C
Default 27 °C is the upper edge of the Holiday Climate Index "ideal comfort" band (Scott, Rutty, Amelung & Tang, 2016). Above this, most warm-tourism travellers report measurable discomfort.
How is this scored? HCI / Steadman / CCI gate — full methodology and citations below.
Compare with another destination
Add as many as you like — stacked below the main strips above. Each row is just the recent-window score strip and (for beach destinations) sea-temperature strip.
Tours in Santiago
22 top-rated tours via Viator. Booking links earn this site a commission at no cost to you. Map locations are approximate (centred on Santiago).
- 1
 Santiago: Valparaiso, Viña del Mar & Casablanca Experience
 - 2
 Santiago: Half-Day Sightseeing City Tour with Chauffeur and Guide
 - 3
 Valparaiso Port and Viña del Mar with Casablanca Wine Tasting
 - 4
 Maipo Valley Wine Tour with 4 vineyards from Santiago.
 - 5
 Inca Lagoon in Andes Mountain Range - Visit Local Vineyard with Tasting included
 - 6
 Andes Day Volcano 8K - Cajón del Maipo
 - 7
 4 Exclusive & boutique wineries in Casablanca - Tanino Restaurant
 - 8
 Cable Car, Funicular and Sightseeing Bus in Santiago one day
 - 9
 Viña Concha y Toro: Premium Wine Center Tour
 - 10
 Farellones Park Tour
 - 11
 A Fabulous Walking tour by the Old Santiago of Chile -
 - 12
 Tour to Valparaíso, Viña del Mar, Pablo Neruda Museum and Vineyard
 - 13
 Cable Car, Funicular and Sightseeing Bus in Santiago two days
 - 14
 The best walking tour in Santiago de Chile
 - 15
 Marquis de Casa Concha: Wine tasting in Concha y Toro
 - 16
 Santiago: Viña del Mar, Valparaiso, with Casablanca Wine Tasting
 - 17
 Private Tour: Santiago at Night with Dinner and Show
 - 18
 Private Tour: Viña del Mar and Valparaíso Tour with Wine Tasting in Casablanca Valley
 - 19
 Half-Day Private Tour: Concha y Toro Vineyard from Santiago Winetasting Included
 - 20
 Private Santiago City Half Day Tour
 - 21
 Private Santiago Full-Day Layover Tour
 - 22
 Traditional Dinner Show in Santiago
Last refreshed 2026-05-30.
Similar climatesValparaíso89% · Mendoza87% · Buenos Aires87%
Other destinations with the most-alike year-round climate to Santiago (apparent temperature, rain hours, sunshine — matched within the same trip-profile). The ±N chip compares each match's typical score for the current month against Santiago's. Based on the 2020-2024 climatology, not this year's actual weather.
Month-by-month
| Month | Temp °C | Feels °C | Rain days | Rain h | Rain h/day | Humidity | Wind km/h | Sun h | UV | Interest | Score |
|---|---|---|---|---|---|---|---|---|---|---|---|
| Jan | 15–30 | 28 | 1 | 8 | 8.0 | 32% | 19 | 315 | 12 | Quiet | 9 |
| Feb | 15–30 | 29 | 1 | 11 | 11.0 | 34% | 18 | 268 | 11 | Quiet | 9 |
| Mar | 14–29 | 27 | 1 | 7 | 7.0 | 34% | 17 | 271 | 8 | Quiet | 9 |
| Apr | 12–24 | 22 | 2 | 25 | 12.5 | 42% | 14 | 220 | 5 | Quiet | 10 |
| May | 9–19 | 17 | 3 | 40 | 13.3 | 52% | 10 | 188 | 3 | Quiet | 9 |
| Jun | 8–15 | 14 | 7 | 91 | 13.0 | 61% | 10 | 136 | 2 | Quiet | 7 |
| Jul | 7–15 | 13 | 4 | 47 | 11.8 | 58% | 9 | 175 | 2 | Quiet | 8 |
| Aug | 7–16 | 15 | 6 | 80 | 13.3 | 62% | 11 | 191 | 3 | Busy | 8 |
| Sep | 8–18 | 17 | 6 | 67 | 11.2 | 56% | 13 | 203 | 5 | Moderate | 9 |
| Oct | 10–23 | 21 | 4 | 31 | 7.8 | 44% | 16 | 264 | 8 | Moderate | 10 |
| Nov | 12–26 | 24 | 1 | 15 | 15.0 | 37% | 17 | 273 | 10 | Peak | 9 |
| Dec | 14–29 | 27 | 0 | 2 | — | 30% | 18 | 312 | 11 | Moderate | 9 |
UV Index in Santiago by Month
UV index in Santiago peaks at 12 (extreme) in January, dropping to 2 (low) in June. January, February, March, November, December reach very high or extreme levels — apply SPF 50+, wear a hat and protective clothing, and limit direct sun between 11:00 and 17:00.
Best months in detail
October
10/1010–23°C (feels 21°C) · 4 rain days (31h) · 264 sun hours · 44% humidity · Moderate crowd · UV 8 (high) · sunniest 1 in 10 days reach 9 (very high)
April
10/1012–24°C (feels 22°C) · 2 rain days (25h) · 220 sun hours · 42% humidity · Quiet crowd · UV 5 (moderate) · sunniest 1 in 10 days reach 7 (high)
November
9/1012–26°C (feels 24°C) · 1 rain days (15h) · 273 sun hours · 37% humidity · Peak crowd · UV 10 (very high) · sunniest 1 in 10 days reach 12 (extreme)
Every month
Show the other 9 months in detail
January
9/1015–30°C (feels 28°C) · 1 rain days (8h) · 315 sun hours · 32% humidity · Quiet crowd · UV 12 (extreme)
February
9/1015–30°C (feels 29°C) · 1 rain days (11h) · 268 sun hours · 34% humidity · Quiet crowd · UV 11 (very high) · sunniest 1 in 10 days reach 12 (extreme)
March
9/1014–29°C (feels 27°C) · 1 rain days (7h) · 271 sun hours · 34% humidity · Quiet crowd · UV 8 (very high)
May
9/109–19°C (feels 17°C) · 3 rain days (40h) · 188 sun hours · 52% humidity · Quiet crowd · UV 3 (low) · sunniest 1 in 10 days reach 4 (moderate)
June
7/108–15°C (feels 14°C) · 7 rain days (91h) · 136 sun hours · 61% humidity · Quiet crowd · UV 2 (low)
July
8/107–15°C (feels 13°C) · 4 rain days (47h) · 175 sun hours · 58% humidity · Quiet crowd · UV 2 (low) · sunniest 1 in 10 days reach 3 (moderate)
August
8/107–16°C (feels 15°C) · 6 rain days (80h) · 191 sun hours · 62% humidity · Busy crowd · UV 3 (moderate)
September
9/108–18°C (feels 17°C) · 6 rain days (67h) · 203 sun hours · 56% humidity · Moderate crowd · UV 5 (moderate) · sunniest 1 in 10 days reach 7 (high)
December
9/1014–29°C (feels 27°C) · 0 rain days (2h) · 312 sun hours · 30% humidity · Moderate crowd · UV 11 (extreme) · sunniest 1 in 10 days reach 13 (extreme)
Frequently asked questions about visiting Santiago
When is the best time to visit Santiago?
October is the highest-scoring month (10/10 on the Holiday Climate Index). Typical conditions: 10–23°C (4 rainy days). The top three months by score are October, April, November.
What is the worst time to visit Santiago?
June is the lowest-scoring month (7/10). Typical conditions: 8–15°C (7 rainy days).
When are crowds lowest in Santiago?
Search-interest seasonality (Google Trends 2021-2025) is lowest in January and peaks in November. Interest tracks both in-trip visitors and lead-time planners, so treat it as a "destination is on people's minds" signal rather than literal arrivals.
Which months in Santiago have good weather but fewer tourists?
April (climate 10/10, crowd index 3) and October (climate 10/10, crowd index 46) — shoulder months with above-average climate and below-median search-interest. Often the best value-for-weather trade.
What is the UV index in Santiago by month?
UV peaks at 12 (extreme) in January and is lowest in June at 2 (low). Monthly peak values: Jan 12, Feb 11, Mar 8, Apr 5, May 3, Jun 2, Jul 2, Aug 3, Sep 5, Oct 8, Nov 10, Dec 11. January, February, March, November, December reach very high or extreme levels — apply SPF 50+, wear a hat and protective clothing, and limit direct sun between 11:00 and 17:00.
What is the UV index in Santiago in January?
January is the peak UV month in Santiago, with a daily-peak UV index of 12 (extreme). At this level, sunburn can occur in under 20 minutes on unprotected fair skin. Apply SPF 50+, wear protective clothing and a hat, and avoid direct midday sun (11:00–17:00).
How high can UV get in Santiago on the sunniest days?
Most days look like the monthly average, but on the sunniest ~1 in 10 days UV climbs higher than the mean suggests. December is the worst case: typical days average UV 11 (extreme), but the top 10% of days reach UV 13 (extreme) — and even higher. Months where the sunniest days routinely exceed the typical reading: February, April, May, July, September, October, November, December. Plan sun protection for the worst case, not the average.
Is air quality in Santiago bad for travelers?
PM2.5 (fine-particle pollution) exceeds the WHO sensitive-group guideline (15 µg/m³) in 12 months: January, February, March, April, May, June, July, August, September, October, November, December. The worst month is June with a typical-day mean of 68 µg/m³ (hazardous); on the worst 10% of days PM2.5 reaches 114 µg/m³ (hazardous) and higher. People with asthma, heart conditions, or sensitive children may want to avoid these months or limit outdoor activity. Source: CAMS via Open-Meteo.