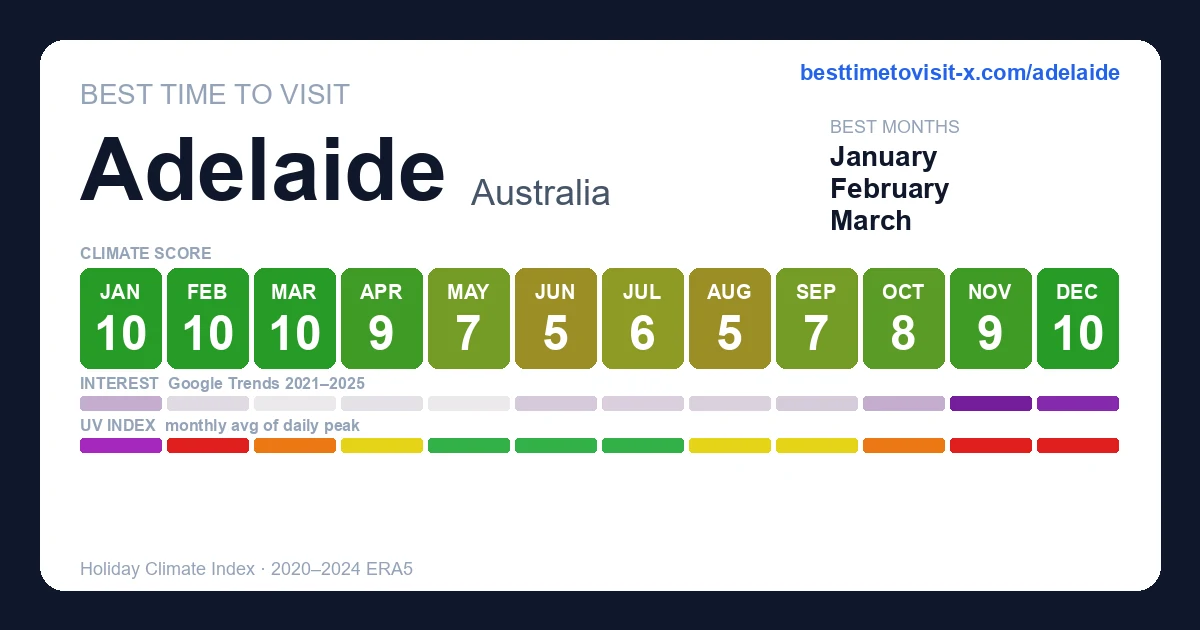
Best time to visit Adelaide
Re-score for me — drag the dial — every chart on the page recolours live for your heat limit 27°C
Default 27 °C is the upper edge of the Holiday Climate Index "ideal comfort" band (Scott, Rutty, Amelung & Tang, 2016). Above this, most warm-tourism travellers report measurable discomfort.
How is this scored? HCI / Steadman / CCI gate — full methodology and citations below.
Compare with another destination
Add as many as you like — stacked below the main strips above. Each row is just the recent-window score strip and (for beach destinations) sea-temperature strip.
Tours in Adelaide
16 top-rated tours via Viator. Booking links earn this site a commission at no cost to you. Map locations are approximate (centred on Adelaide).
- 1
 Barossa Valley Premium Wine Tasting Experience with Winery Lunch
 - 2
 Barossa Valley Cellar Door Small Group Tour
 - 3
 Kangaroo Island in a Day Tour from Adelaide
 - 4
 RoofClimb Adelaide Oval Experience
 - 5
 Hahndorf and Hills Wine and/or Gin Tour
 - 6
 Small-Group River Murray Dark Sky and Sunset Tour with Dinner
 - 7
 Horse Trail Ride and Wine Tasting at Adelaide Hills Winery
 - 8
 Wild Dolphin Watch in Glenelg
 - 9
 Adelaide City Kayak Tour
 - 10
 Adelaide City Highlights via Hahndorf Half-Day Tour
 - 11
 Barossa Valley Gin and Wine Tour
 - 12
 Half Day Adelaide City Highlights Mt Lofty & Hahndorf Tour Join Us Tour
 - 13
 Discover Barossa: 4 Wine Tastings, Gourmet Lunch, and Hidden Gems
 - 14
 Charms of Hahndorf and Hills Full-day Tour
 - 15
 Full Day Adelaide Private Guided Car Tour
 - 16
 Victor Harbor and Southern Highlights from Adelaide
Last refreshed 2026-05-30.
Similar climatesMelbourne87% · Canberra87% · Montevideo86%
Other destinations with the most-alike year-round climate to Adelaide (apparent temperature, rain hours, sunshine — matched within the same trip-profile). The ±N chip compares each match's typical score for the current month against Adelaide's. Based on the 2020-2024 climatology, not this year's actual weather.
Month-by-month
| Month | Temp °C | Feels °C | Rain days | Rain h | Rain h/day | Humidity | Wind km/h | Sun h | UV | Interest | Score |
|---|---|---|---|---|---|---|---|---|---|---|---|
| Jan | 16–27 | 26 | 5 | 50 | 10.0 | 45% | 24 | 285 | 12 | Quiet | 10 |
| Feb | 16–26 | 25 | 3 | 39 | 13.0 | 44% | 24 | 250 | 10 | Quiet | 10 |
| Mar | 15–25 | 23 | 5 | 45 | 9.0 | 46% | 21 | 252 | 8 | Quiet | 10 |
| Apr | 13–21 | 19 | 9 | 102 | 11.3 | 53% | 20 | 209 | 5 | Quiet | 9 |
| May | 10–18 | 15 | 10 | 132 | 13.2 | 61% | 20 | 192 | 3 | Quiet | 7 |
| Jun | 9–15 | 12 | 16 | 199 | 12.4 | 72% | 22 | 164 | 2 | Quiet | 5 |
| Jul | 8–14 | 11 | 11 | 153 | 13.9 | 72% | 21 | 188 | 2 | Quiet | 6 |
| Aug | 9–15 | 13 | 15 | 185 | 12.3 | 70% | 21 | 204 | 3 | Quiet | 5 |
| Sep | 10–18 | 15 | 12 | 131 | 10.9 | 60% | 23 | 220 | 5 | Quiet | 7 |
| Oct | 11–20 | 17 | 9 | 119 | 13.2 | 56% | 24 | 249 | 7 | Quiet | 8 |
| Nov | 13–23 | 21 | 8 | 91 | 11.4 | 50% | 24 | 259 | 8 | Peak | 9 |
| Dec | 15–25 | 23 | 5 | 52 | 10.4 | 46% | 24 | 290 | 10 | Peak | 10 |
UV Index in Adelaide by Month
UV index in Adelaide peaks at 12 (extreme) in January, dropping to 2 (low) in June. January, February, November, December reach very high or extreme levels — apply SPF 50+, wear a hat and protective clothing, and limit direct sun between 11:00 and 17:00.
Best months in detail
February
10/1016–26°C (feels 25°C) · 3 rain days (39h) · 250 sun hours · 44% humidity · Quiet crowd · UV 10 (very high) · sunniest 1 in 10 days reach 12 (extreme)
March
10/1015–25°C (feels 23°C) · 5 rain days (45h) · 252 sun hours · 46% humidity · Quiet crowd · UV 8 (high) · sunniest 1 in 10 days reach 10 (very high)
December
10/1015–25°C (feels 23°C) · 5 rain days (52h) · 290 sun hours · 46% humidity · Peak crowd · UV 10 (very high) · sunniest 1 in 10 days reach 13 (extreme)
Every month
Show the other 9 months in detail
January
10/1016–27°C (feels 26°C) · 5 rain days (50h) · 285 sun hours · 45% humidity · Quiet crowd · UV 12 (extreme) · sunniest 1 in 10 days reach 13 (extreme)
April
9/1013–21°C (feels 19°C) · 9 rain days (102h) · 209 sun hours · 53% humidity · Quiet crowd · UV 5 (moderate) · sunniest 1 in 10 days reach 6 (high)
May
7/1010–18°C (feels 15°C) · 10 rain days (132h) · 192 sun hours · 61% humidity · Quiet crowd · UV 3 (low) · sunniest 1 in 10 days reach 4 (moderate)
June
5/109–15°C (feels 12°C) · 16 rain days (199h) · 164 sun hours · 72% humidity · Quiet crowd · UV 2 (low)
July
6/108–14°C (feels 11°C) · 11 rain days (153h) · 188 sun hours · 72% humidity · Quiet crowd · UV 2 (low)
August
5/109–15°C (feels 13°C) · 15 rain days (185h) · 204 sun hours · 70% humidity · Quiet crowd · UV 3 (moderate)
September
7/1010–18°C (feels 15°C) · 12 rain days (131h) · 220 sun hours · 60% humidity · Quiet crowd · UV 5 (moderate) · sunniest 1 in 10 days reach 6 (high)
October
8/1011–20°C (feels 17°C) · 9 rain days (119h) · 249 sun hours · 56% humidity · Quiet crowd · UV 7 (high) · sunniest 1 in 10 days reach 9 (very high)
November
9/1013–23°C (feels 21°C) · 8 rain days (91h) · 259 sun hours · 50% humidity · Peak crowd · UV 8 (very high) · sunniest 1 in 10 days reach 10 (very high)
Frequently asked questions about visiting Adelaide
When is the best time to visit Adelaide?
February is the highest-scoring month (10/10 on the Holiday Climate Index). Typical conditions: 16–26°C (3 rainy days). The top three months by score are February, March, December.
What is the worst time to visit Adelaide?
June is the lowest-scoring month (5/10). Typical conditions: 9–15°C (16 rainy days).
When are crowds lowest in Adelaide?
Search-interest seasonality (Google Trends 2021-2025) is lowest in March and peaks in November. Interest tracks both in-trip visitors and lead-time planners, so treat it as a "destination is on people's minds" signal rather than literal arrivals.
Which months in Adelaide have good weather but fewer tourists?
January (climate 10/10, crowd index 31) and February (climate 10/10, crowd index 8) — shoulder months with above-average climate and below-median search-interest. Often the best value-for-weather trade.
What is the UV index in Adelaide by month?
UV peaks at 12 (extreme) in January and is lowest in June at 2 (low). Monthly peak values: Jan 12, Feb 10, Mar 8, Apr 5, May 3, Jun 2, Jul 2, Aug 3, Sep 5, Oct 7, Nov 8, Dec 10. January, February, November, December reach very high or extreme levels — apply SPF 50+, wear a hat and protective clothing, and limit direct sun between 11:00 and 17:00.
What is the UV index in Adelaide in January?
January is the peak UV month in Adelaide, with a daily-peak UV index of 12 (extreme). At this level, sunburn can occur in under 20 minutes on unprotected fair skin. Apply SPF 50+, wear protective clothing and a hat, and avoid direct midday sun (11:00–17:00).
How high can UV get in Adelaide on the sunniest days?
Most days look like the monthly average, but on the sunniest ~1 in 10 days UV climbs higher than the mean suggests. January is the worst case: typical days average UV 12 (extreme), but the top 10% of days reach UV 13 (extreme) — and even higher. Months where the sunniest days routinely exceed the typical reading: January, February, March, April, May, September, October, November, December. Plan sun protection for the worst case, not the average.