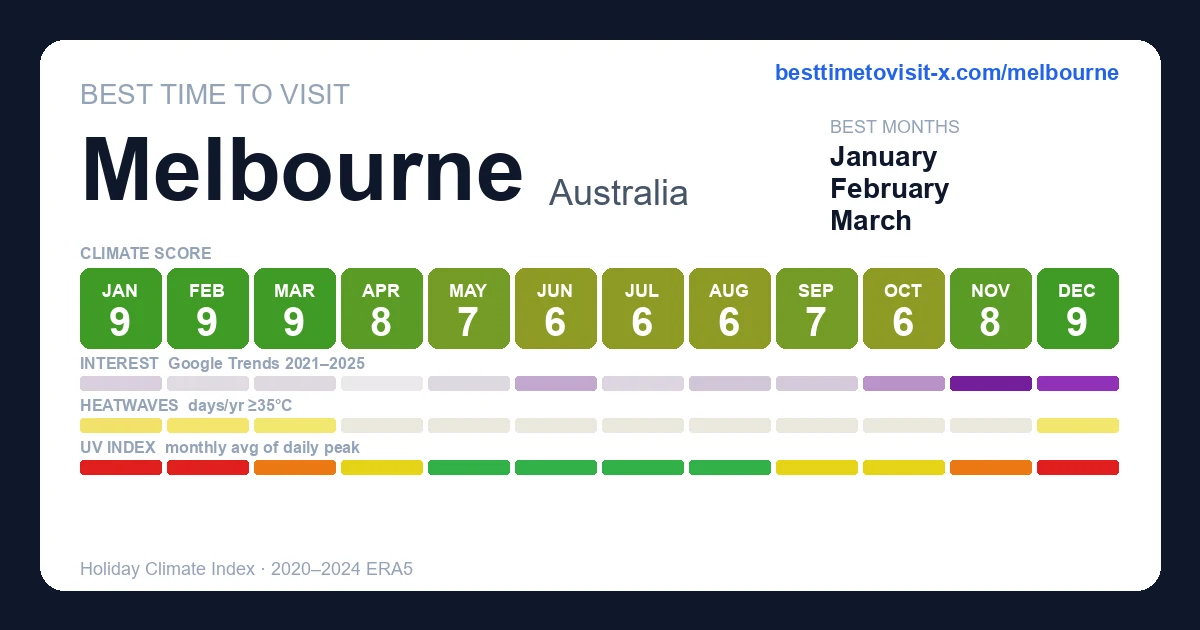
Best time to visit Melbourne
Re-score for me — drag the dial — every chart on the page recolours live for your heat limit 27°C
Default 27 °C is the upper edge of the Holiday Climate Index "ideal comfort" band (Scott, Rutty, Amelung & Tang, 2016). Above this, most warm-tourism travellers report measurable discomfort.
How is this scored? HCI / Steadman / CCI gate — full methodology and citations below.
Compare with another destination
Add as many as you like — stacked below the main strips above. Each row is just the recent-window score strip and (for beach destinations) sea-temperature strip.
Tours in Melbourne
30 top-rated tours via Viator. Booking links earn this site a commission at no cost to you. Map locations are approximate (centred on Melbourne).
- 1
 Great Ocean Road and 12 Apostles Private Day Tour
 - 2
 Yarra Valley Wine Tour from Melbourne - Choc, Gin & Good Times
 - 3
 Great Ocean Road Reverse Itinerary Boutique Tour - Max 12 Guests
 - 4
 Melbourne Premium Balloon Flight plus 5-Star champagne breakfast
 - 5
 Melbourne Premium Balloon Flight
 - 6
 Great Ocean Road Reverse Itinerary PREMIUM Tour - Max 12 Guests
 - 7
 Yarra Valley Food Wine and Gin Tour Departing From Melbourne
 - 8
 Yarra Valley Winery Tour from Melbourne - Lunch included
 - 9
 Yarra Valley sunrise balloon flight & champagne breakfast
 - 10
 Puffing Billy And Phillip Island Penguin Parade Bus Tour
 - 11
 Puffing Billy And Healesville Sanctuary Scenic Tour
 - 12
 Great Ocean Road Small-Group Eco Tour from Melbourne
 - 13
 Melbourne: Yarra Valley Wine, Gin, Whisky and Chocolate Tour
 - 14
 Phillip Island Penguins & Wildlife Day Tour from Melbourne
 - 15
 Melbourne: Yarra Valley Wine Tour with Gin, Cider & Chocolate
 - 16
 Great Ocean Road Reverse SUNRISE TOUR–SML GRP-LUX BUS Hotel Pikup
 - 17
 Penguin Parade, & Wildlife Encounters Eco Tour from Melbourne
 - 18
 Ultimate Melbourne Walking Tour: History, Laneways & Culture
 - 19
 Great Ocean Road Full-Day Sunset Eco Tour from Melbourne
 - 20
 Phillip Island Penguin and Koala Highlights Day-Trip from Melbourne
 - 21
 Epic Yarra Valley Wine Tour from Melbourne with Lunch & Tastings
 - 22
 Small-Group Phillip Island Afternoon Day Trip from Melbourne
 - 23
 Melbourne Foodie Discovery Walking Tour with 7 Food Tastings
 - 24
 Great Ocean Road, 12 Apostles, Loch Ard Gorge & lunch - Melbourne
 - 25
 Grampians National Park Small-Group Eco Tour from Melbourne
 - 26
 Full-Day Phillip Island Tour with Kangaroo, Koala and Penguin Parade
 - 27
 Full-Day Great Ocean Road and 12 Apostles Tour
 - 28
 Great Ocean Road Tour Plus Koalas, Forest Walk and Morning Tea
 - 29
 Hot Air Balloon Flights over Melbourne City (optional breakfast)
 - 30
 Premium Great Ocean Road Tour Reverse - Max 11 Hotel Pickup
Last refreshed 2026-05-26.
Similar climatesNapier92% · Hobart92% · Nelson91%
Other destinations with the most-alike year-round climate to Melbourne (apparent temperature, rain hours, sunshine — matched within the same trip-profile). The ±N chip compares each match's typical score for the current month against Melbourne's. Based on the 2020-2024 climatology, not this year's actual weather.
Month-by-month
| Month | Temp °C | Feels °C | Rain days | Rain h | Rain h/day | Humidity | Wind km/h | Sun h | UV | Interest | Score |
|---|---|---|---|---|---|---|---|---|---|---|---|
| Jan | 15–26 | 25 | 9 | 107 | 11.9 | 54% | 22 | 252 | 9 | Quiet | 9 |
| Feb | 14–25 | 24 | 6 | 76 | 12.7 | 52% | 23 | 233 | 8 | Quiet | 9 |
| Mar | 13–23 | 22 | 8 | 107 | 13.4 | 54% | 21 | 221 | 6 | Quiet | 9 |
| Apr | 10–19 | 18 | 10 | 128 | 12.8 | 62% | 20 | 185 | 4 | Quiet | 8 |
| May | 8–16 | 14 | 11 | 118 | 10.7 | 69% | 19 | 171 | 2 | Quiet | 7 |
| Jun | 7–14 | 11 | 12 | 137 | 11.4 | 73% | 21 | 149 | 1 | Quiet | 6 |
| Jul | 6–13 | 10 | 12 | 131 | 10.9 | 73% | 21 | 154 | 2 | Quiet | 6 |
| Aug | 7–15 | 12 | 13 | 135 | 10.4 | 67% | 23 | 187 | 2 | Quiet | 6 |
| Sep | 8–17 | 14 | 12 | 131 | 10.9 | 60% | 24 | 204 | 4 | Quiet | 7 |
| Oct | 9–19 | 16 | 14 | 178 | 12.7 | 61% | 23 | 219 | 5 | Moderate | 6 |
| Nov | 12–21 | 20 | 12 | 136 | 11.3 | 57% | 22 | 236 | 7 | Peak | 8 |
| Dec | 13–24 | 22 | 10 | 119 | 11.9 | 52% | 22 | 267 | 9 | Busy | 9 |
UV Index in Melbourne by Month
UV index in Melbourne peaks at 9 (very high) in January, dropping to 1 (low) in June. January, February, December reach very high or extreme levels — apply SPF 50+, wear a hat and protective clothing, and limit direct sun between 11:00 and 17:00.
Best months in detail
February
9/1014–25°C (feels 24°C) · 6 rain days (76h) · 233 sun hours · 52% humidity · Quiet crowd · UV 8 (very high) · sunniest 1 in 10 days reach 11 (extreme)
March
9/1013–23°C (feels 22°C) · 8 rain days (107h) · 221 sun hours · 54% humidity · Quiet crowd · UV 6 (high) · sunniest 1 in 10 days reach 9 (very high)
January
9/1015–26°C · 9 rain days (107h) · 252 sun hours · 54% humidity · Quiet crowd · UV 9 (very high) · sunniest 1 in 10 days reach 12 (extreme)
Every month
Show the other 9 months in detail
April
8/1010–19°C (feels 18°C) · 10 rain days (128h) · 185 sun hours · 62% humidity · Quiet crowd · UV 4 (moderate)
May
7/108–16°C (feels 14°C) · 11 rain days (118h) · 171 sun hours · 69% humidity · Quiet crowd · UV 2 (low) · sunniest 1 in 10 days reach 3 (moderate)
June
6/107–14°C (feels 11°C) · 12 rain days (137h) · 149 sun hours · 73% humidity · Quiet crowd · UV 1 (low)
July
6/106–13°C (feels 10°C) · 12 rain days (131h) · 154 sun hours · 73% humidity · Quiet crowd · UV 2 (low)
August
6/107–15°C (feels 12°C) · 13 rain days (135h) · 187 sun hours · 67% humidity · Quiet crowd · UV 2 (low) · sunniest 1 in 10 days reach 3 (moderate)
September
7/108–17°C (feels 14°C) · 12 rain days (131h) · 204 sun hours · 60% humidity · Quiet crowd · UV 4 (moderate) · sunniest 1 in 10 days reach 5 (moderate)
October
6/109–19°C (feels 16°C) · 14 rain days (178h) · 219 sun hours · 61% humidity · Moderate crowd · UV 5 (moderate) · sunniest 1 in 10 days reach 8 (high)
November
8/1012–21°C (feels 20°C) · 12 rain days (136h) · 236 sun hours · 57% humidity · Peak crowd · UV 7 (high) · sunniest 1 in 10 days reach 9 (very high)
December
9/1013–24°C (feels 22°C) · 10 rain days (119h) · 267 sun hours · 52% humidity · Busy crowd · UV 9 (very high) · sunniest 1 in 10 days reach 12 (extreme)
Frequently asked questions about visiting Melbourne
When is the best time to visit Melbourne?
February is the highest-scoring month (9/10 on the Holiday Climate Index). Typical conditions: 14–25°C (6 rainy days). The top three months by score are February, March, January.
What is the worst time to visit Melbourne?
July is the lowest-scoring month (6/10). Typical conditions: 6–13°C (12 rainy days).
When are crowds lowest in Melbourne?
Search-interest seasonality (Google Trends 2021-2025) is lowest in April and peaks in November. Interest tracks both in-trip visitors and lead-time planners, so treat it as a "destination is on people's minds" signal rather than literal arrivals.
Which months in Melbourne have good weather but fewer tourists?
January (climate 9/10, crowd index 14) and February (climate 9/10, crowd index 8) — shoulder months with above-average climate and below-median search-interest. Often the best value-for-weather trade.
What is the UV index in Melbourne by month?
UV peaks at 9 (very high) in January and is lowest in June at 1 (low). Monthly peak values: Jan 9, Feb 8, Mar 6, Apr 4, May 2, Jun 1, Jul 2, Aug 2, Sep 4, Oct 5, Nov 7, Dec 9. January, February, December reach very high or extreme levels — apply SPF 50+, wear a hat and protective clothing, and limit direct sun between 11:00 and 17:00.
What is the UV index in Melbourne in January?
January is the peak UV month in Melbourne, with a daily-peak UV index of 9 (very high). At this level, sunburn can occur in under 20 minutes on unprotected fair skin. Apply SPF 50+, wear protective clothing and a hat, and avoid direct midday sun (11:00–17:00).
How high can UV get in Melbourne on the sunniest days?
Most days look like the monthly average, but on the sunniest ~1 in 10 days UV climbs higher than the mean suggests. January is the worst case: typical days average UV 9 (very high), but the top 10% of days reach UV 12 (extreme) — and even higher. Months where the sunniest days routinely exceed the typical reading: January, February, March, May, August, September, October, November, December. Plan sun protection for the worst case, not the average.