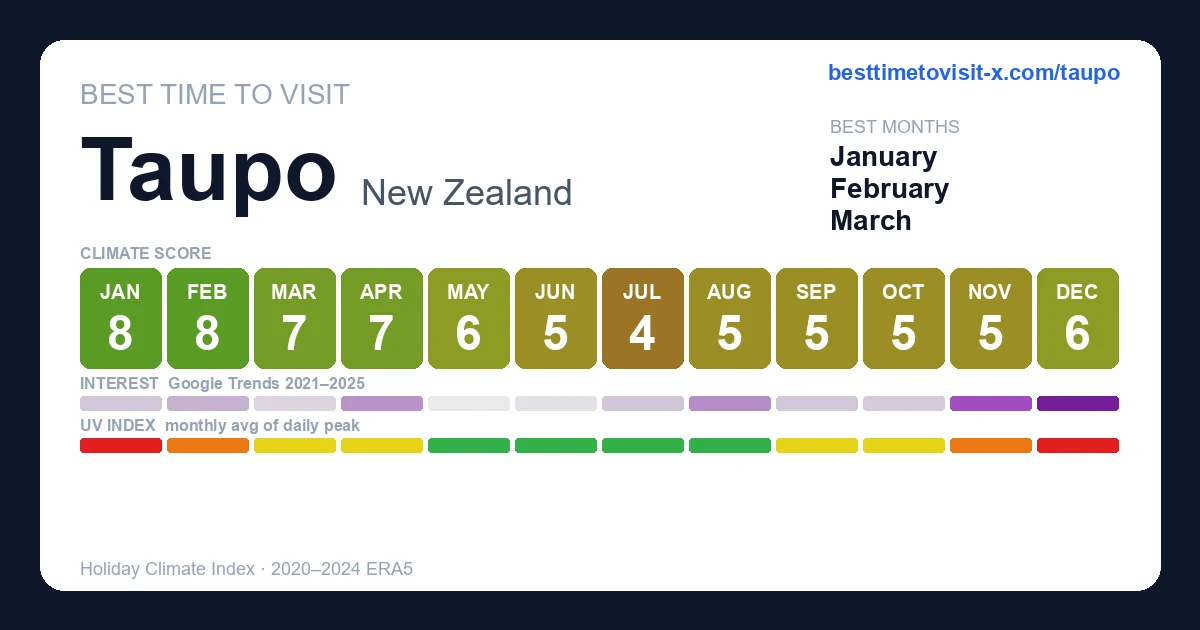
Best time to visit Taupo
Re-score for me — drag the dial — every chart on the page recolours live for your heat limit 27°C
Default 27 °C is the upper edge of the Holiday Climate Index "ideal comfort" band (Scott, Rutty, Amelung & Tang, 2016). Above this, most warm-tourism travellers report measurable discomfort.
How is this scored? HCI / Steadman / CCI gate — full methodology and citations below.
Compare with another destination
Add as many as you like — stacked below the main strips above. Each row is just the recent-window score strip and (for beach destinations) sea-temperature strip.
Tours in Taupo
9 top-rated tours via Viator. Booking links earn this site a commission at no cost to you. Map locations are approximate (centred on Taupo).
- 1
 Waikato River Jet Boat Ride from Taupo
 - 2
 Lake Taupō Māori Rock Carvings Scenic Cruise aboard Ernest Kemp
 - 3
 Evening Eco Sailing Adventure to Māori Rock Carvings Lake Taupō
 - 4
 Evening Lake Taupō Boat Charter Kakariki Catamaran
 - 5
 Kakariki Day Time Cruise to Maori Rock Carvings
 - 6
 2-Hour Waikato River Guided Kayak Trip from Taupo
 - 7
 Chasing Waterfalls The Adventurer from Kinloch Marina
 - 8
 Western Bays Sightseeing Tour from Kinloch Lake Taupo
 - 9
 Hukafalls Jet Boat Ride in Taupo
Last refreshed 2026-06-08.
Similar climatesRotorua95% · Nelson93% · Auckland92%
Other destinations with the most-alike year-round climate to Taupo (apparent temperature, rain hours, sunshine — matched within the same trip-profile). The ±N chip compares each match's typical score for the current month against Taupo's. Based on the 2020-2024 climatology, not this year's actual weather.
Month-by-month
| Month | Temp °C | Feels °C | Rain days | Rain h | Rain h/day | Humidity | Wind km/h | Sun h | UV | Interest | Score |
|---|---|---|---|---|---|---|---|---|---|---|---|
| Jan | 13–22 | 20 | 12 | 153 | 12.8 | 60% | 20 | 270 | 8 | Quiet | 8 |
| Feb | 13–22 | 20 | 11 | 139 | 12.6 | 62% | 20 | 222 | 7 | Quiet | 8 |
| Mar | 11–19 | 17 | 11 | 140 | 12.7 | 64% | 20 | 229 | 6 | Quiet | 7 |
| Apr | 10–16 | 15 | 9 | 128 | 14.2 | 70% | 19 | 193 | 3 | Moderate | 7 |
| May | 7–13 | 11 | 10 | 144 | 14.4 | 77% | 19 | 171 | 2 | Quiet | 6 |
| Jun | 6–12 | 9 | 13 | 188 | 14.5 | 81% | 20 | 141 | 1 | Quiet | 5 |
| Jul | 5–10 | 7 | 13 | 190 | 14.6 | 80% | 21 | 151 | 1 | Quiet | 4 |
| Aug | 4–11 | 8 | 11 | 165 | 15.0 | 76% | 19 | 180 | 2 | Moderate | 5 |
| Sep | 6–13 | 9 | 14 | 181 | 12.9 | 71% | 23 | 197 | 3 | Quiet | 5 |
| Oct | 8–15 | 12 | 15 | 215 | 14.3 | 69% | 20 | 209 | 5 | Quiet | 5 |
| Nov | 10–18 | 15 | 15 | 209 | 13.9 | 68% | 22 | 237 | 7 | Busy | 5 |
| Dec | 13–20 | 19 | 14 | 196 | 14.0 | 65% | 21 | 252 | 8 | Peak | 6 |
UV Index in Taupo by Month
UV index in Taupo peaks at 8 (very high) in January, dropping to 1 (low) in June. January, December reach very high or extreme levels — apply SPF 50+, wear a hat and protective clothing, and limit direct sun between 11:00 and 17:00.
Best months in detail
February
8/1013–22°C (feels 20°C) · 11 rain days (139h) · 222 sun hours · 62% humidity · Quiet crowd · UV 7 (high) · sunniest 1 in 10 days reach 10 (very high)
January
8/1013–22°C (feels 20°C) · 12 rain days (153h) · 270 sun hours · 60% humidity · Quiet crowd · UV 8 (very high) · sunniest 1 in 10 days reach 11 (very high)
March
7/1011–19°C (feels 17°C) · 11 rain days (140h) · 229 sun hours · 64% humidity · Quiet crowd · UV 6 (moderate) · sunniest 1 in 10 days reach 8 (high)
Every month
Show the other 9 months in detail
April
7/1010–16°C (feels 15°C) · 9 rain days (128h) · 193 sun hours · 70% humidity · Moderate crowd · UV 3 (moderate) · sunniest 1 in 10 days reach 5 (moderate)
May
6/107–13°C (feels 11°C) · 10 rain days (144h) · 171 sun hours · 77% humidity · Quiet crowd · UV 2 (low)
June
5/106–12°C (feels 9°C) · 13 rain days (188h) · 141 sun hours · 81% humidity · Quiet crowd · UV 1 (low)
July
4/105–10°C (feels 7°C) · 13 rain days (190h) · 151 sun hours · 80% humidity · Quiet crowd · UV 1 (low)
August
5/104–11°C (feels 8°C) · 11 rain days (165h) · 180 sun hours · 76% humidity · Moderate crowd · UV 2 (low) · sunniest 1 in 10 days reach 3 (moderate)
September
5/106–13°C (feels 9°C) · 14 rain days (181h) · 197 sun hours · 71% humidity · Quiet crowd · UV 3 (moderate) · sunniest 1 in 10 days reach 5 (moderate)
October
5/108–15°C (feels 12°C) · 15 rain days (215h) · 209 sun hours · 69% humidity · Quiet crowd · UV 5 (moderate) · sunniest 1 in 10 days reach 7 (high)
November
5/1010–18°C (feels 15°C) · 15 rain days (209h) · 237 sun hours · 68% humidity · Busy crowd · UV 7 (high) · sunniest 1 in 10 days reach 9 (very high)
December
6/1013–20°C (feels 19°C) · 14 rain days (196h) · 252 sun hours · 65% humidity · Peak crowd · UV 8 (very high) · sunniest 1 in 10 days reach 12 (extreme)
Frequently asked questions about visiting Taupo
When is the best time to visit Taupo?
February is the highest-scoring month (8/10 on the Holiday Climate Index). Typical conditions: 13–22°C (11 rainy days). The top three months by score are February, January, March.
What is the worst time to visit Taupo?
July is the lowest-scoring month (4/10). Typical conditions: 5–10°C (13 rainy days).
When are crowds lowest in Taupo?
Search-interest seasonality (Google Trends 2021-2025) is lowest in May and peaks in December. Interest tracks both in-trip visitors and lead-time planners, so treat it as a "destination is on people's minds" signal rather than literal arrivals.
Which months in Taupo have good weather but fewer tourists?
January (climate 8/10, crowd index 19) and February (climate 8/10, crowd index 29) — shoulder months with above-average climate and below-median search-interest. Often the best value-for-weather trade.
What is the UV index in Taupo by month?
UV peaks at 8 (very high) in January and is lowest in June at 1 (low). Monthly peak values: Jan 8, Feb 7, Mar 6, Apr 3, May 2, Jun 1, Jul 1, Aug 2, Sep 3, Oct 5, Nov 7, Dec 8. January, December reach very high or extreme levels — apply SPF 50+, wear a hat and protective clothing, and limit direct sun between 11:00 and 17:00.
What is the UV index in Taupo in January?
January is the peak UV month in Taupo, with a daily-peak UV index of 8 (very high). At this level, sunburn can occur in under 20 minutes on unprotected fair skin. Apply SPF 50+, wear protective clothing and a hat, and avoid direct midday sun (11:00–17:00).
How high can UV get in Taupo on the sunniest days?
Most days look like the monthly average, but on the sunniest ~1 in 10 days UV climbs higher than the mean suggests. December is the worst case: typical days average UV 8 (very high), but the top 10% of days reach UV 12 (extreme) — and even higher. Months where the sunniest days routinely exceed the typical reading: January, February, March, April, August, September, October, November, December. Plan sun protection for the worst case, not the average.