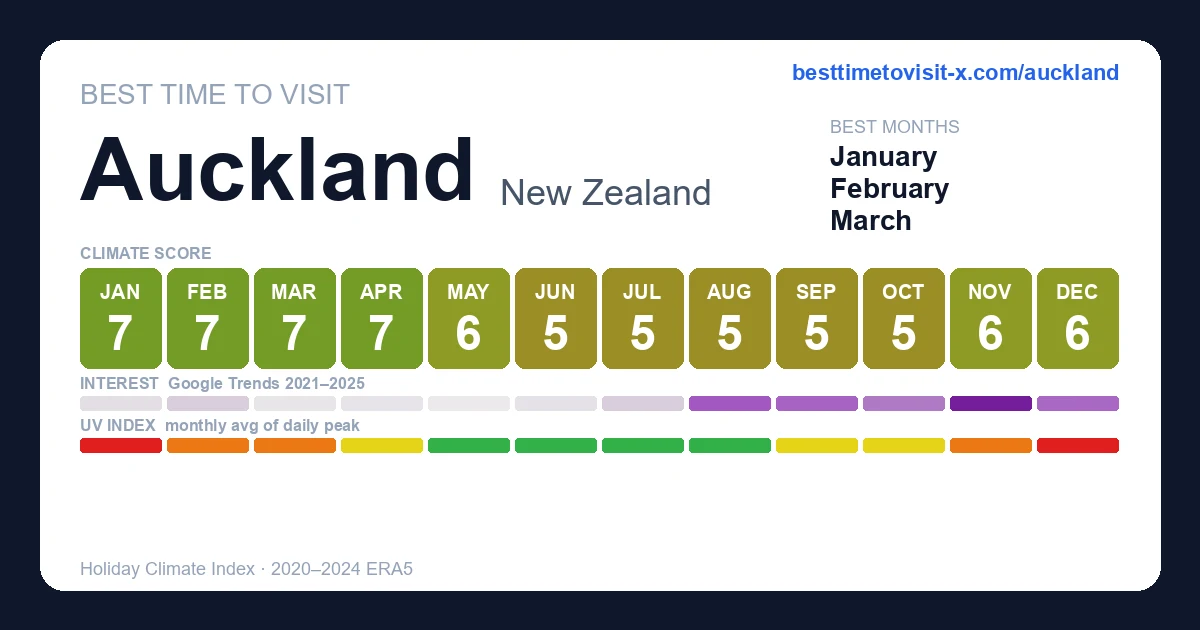
Best time to visit Auckland
Re-score for me — drag the dial — every chart on the page recolours live for your heat limit 27°C
Default 27 °C is the upper edge of the Holiday Climate Index "ideal comfort" band (Scott, Rutty, Amelung & Tang, 2016). Above this, most warm-tourism travellers report measurable discomfort.
How is this scored? HCI / Steadman / CCI gate — full methodology and citations below.
Compare with another destination
Add as many as you like — stacked below the main strips above. Each row is just the recent-window score strip and (for beach destinations) sea-temperature strip.
Tours in Auckland
21 top-rated tours via Viator. Booking links earn this site a commission at no cost to you. Map locations are approximate (centred on Auckland).
- 1
 Hobbiton & Waitomo Caves Guided Day Trip from Auckland incl lunch
 - 2
 From Auckland: Spellbound, Waitomo Glowworm Cave Small Group Tour
 - 3
 Cathedral Cove & Hot Water Beach with Lunch from Auckland
 - 4
 Group tour to Bay of Islands return from Auckland
 - 5
 Hobbiton Movie set & Waitomo Caves Small Group Tour From Auckland
 - 6
 Hobbiton Movie Set Guided Day Tour with Lunch from Auckland
 - 7
 Auckland: Te Puia Rotorua & Waitomo Caves Small Group with Lunch
 - 8
 Auckland Scenic Day Tour Full-Day- 8 HOURS
 - 9
 Magical Hobbiton: Small-Group Guided Tour from Auckland
 - 10
 Shore Excursion: Auckland Scenic Full Day Tour - 8 Hours
 - 11
 Waitomo Glowworm & Ruakuri Twin Cave Experience - Small Group Tour From Auckland
 - 12
 Auckland City Highlights Private Tour
 - 13
 Hobbiton Movie Set Small Group Tour from Auckland
 - 14
 2025 Award Winning: Auckland City Highlights Half Day Tour
 - 15
 Hobbiton & Waitomo Caves Day Tour with Lunch from Auckland
 - 16
 Half-day Discover Auckland City Sightseeing Tour
 - 17
 Afternoon Piha Beach and Rainforest Tour from Auckland
 - 18
 Small-Group Hobbiton Tour from Auckland with Party Marquee Lunch
 - 19
 Skydive Auckland
 - 20
 Hobbiton Movie Set Signature Tour Early Access (Avoid the crowds)
 - 21
 Coromandel Day Tour From Auckland
Last refreshed 2026-05-30.
Similar climatesNelson95% · Rotorua92% · Taupo92%
Other destinations with the most-alike year-round climate to Auckland (apparent temperature, rain hours, sunshine — matched within the same trip-profile). The ±N chip compares each match's typical score for the current month against Auckland's. Based on the 2020-2024 climatology, not this year's actual weather.
Month-by-month
| Month | Temp °C | Feels °C | Rain days | Rain h | Rain h/day | Humidity | Wind km/h | Sun h | UV | Interest | Score |
|---|---|---|---|---|---|---|---|---|---|---|---|
| Jan | 17–23 | 22 | 12 | 164 | 13.7 | 66% | 24 | 269 | 8 | Quiet | 7 |
| Feb | 18–23 | 22 | 11 | 151 | 13.7 | 66% | 24 | 231 | 8 | Quiet | 7 |
| Mar | 16–21 | 20 | 11 | 152 | 13.8 | 65% | 23 | 234 | 6 | Quiet | 7 |
| Apr | 15–20 | 18 | 12 | 156 | 13.0 | 71% | 24 | 202 | 4 | Quiet | 7 |
| May | 12–17 | 15 | 14 | 164 | 11.7 | 74% | 26 | 178 | 2 | Quiet | 6 |
| Jun | 11–16 | 13 | 13 | 166 | 12.8 | 78% | 26 | 157 | 2 | Quiet | 5 |
| Jul | 10–15 | 12 | 12 | 168 | 14.0 | 77% | 27 | 167 | 2 | Quiet | 5 |
| Aug | 9–15 | 12 | 14 | 184 | 13.1 | 76% | 25 | 192 | 2 | Busy | 5 |
| Sep | 11–16 | 13 | 15 | 168 | 11.2 | 72% | 27 | 210 | 4 | Moderate | 5 |
| Oct | 12–17 | 15 | 15 | 195 | 13.0 | 73% | 26 | 227 | 5 | Moderate | 5 |
| Nov | 14–19 | 18 | 17 | 208 | 12.2 | 72% | 24 | 244 | 7 | Peak | 6 |
| Dec | 16–22 | 21 | 15 | 196 | 13.1 | 70% | 24 | 265 | 8 | Moderate | 6 |
UV Index in Auckland by Month
UV index in Auckland peaks at 8 (very high) in January, dropping to 2 (low) in June. January, December reach very high or extreme levels — apply SPF 50+, wear a hat and protective clothing, and limit direct sun between 11:00 and 17:00.
Best months in detail
February
7/1018–23°C · 11 rain days (151h) · 231 sun hours · 66% humidity · Quiet crowd · UV 8 (high) · sunniest 1 in 10 days reach 9 (very high)
March
7/1016–21°C (feels 20°C) · 11 rain days (152h) · 234 sun hours · 65% humidity · Quiet crowd · UV 6 (high) · sunniest 1 in 10 days reach 8 (very high)
January
7/1017–23°C · 12 rain days (164h) · 269 sun hours · 66% humidity · Quiet crowd · UV 8 (very high) · sunniest 1 in 10 days reach 11 (very high)
Every month
Show the other 9 months in detail
April
7/1015–20°C (feels 18°C) · 12 rain days (156h) · 202 sun hours · 71% humidity · Quiet crowd · UV 4 (moderate) · sunniest 1 in 10 days reach 5 (moderate)
May
6/1012–17°C (feels 15°C) · 14 rain days (164h) · 178 sun hours · 74% humidity · Quiet crowd · UV 2 (low) · sunniest 1 in 10 days reach 3 (moderate)
June
5/1011–16°C (feels 13°C) · 13 rain days (166h) · 157 sun hours · 78% humidity · Quiet crowd · UV 2 (low)
July
5/1010–15°C (feels 12°C) · 12 rain days (168h) · 167 sun hours · 77% humidity · Quiet crowd · UV 2 (low)
August
5/109–15°C (feels 12°C) · 14 rain days (184h) · 192 sun hours · 76% humidity · Busy crowd · UV 2 (low) · sunniest 1 in 10 days reach 3 (moderate)
September
5/1011–16°C (feels 13°C) · 15 rain days (168h) · 210 sun hours · 72% humidity · Moderate crowd · UV 4 (moderate)
October
5/1012–17°C (feels 15°C) · 15 rain days (195h) · 227 sun hours · 73% humidity · Moderate crowd · UV 5 (moderate) · sunniest 1 in 10 days reach 7 (high)
November
6/1014–19°C (feels 18°C) · 17 rain days (208h) · 244 sun hours · 72% humidity · Peak crowd · UV 7 (high) · sunniest 1 in 10 days reach 9 (very high)
December
6/1016–22°C · 15 rain days (196h) · 265 sun hours · 70% humidity · Moderate crowd · UV 8 (very high) · sunniest 1 in 10 days reach 11 (extreme)
Frequently asked questions about visiting Auckland
When is the best time to visit Auckland?
February is the highest-scoring month (7/10 on the Holiday Climate Index). Typical conditions: 18–23°C (11 rainy days). The top three months by score are February, March, January.
What is the worst time to visit Auckland?
August is the lowest-scoring month (5/10). Typical conditions: 9–15°C (14 rainy days).
When are crowds lowest in Auckland?
Search-interest seasonality (Google Trends 2021-2025) is lowest in May and peaks in November. Interest tracks both in-trip visitors and lead-time planners, so treat it as a "destination is on people's minds" signal rather than literal arrivals.
Which months in Auckland have good weather but fewer tourists?
January (climate 7/10, crowd index 6) and February (climate 7/10, crowd index 15) — shoulder months with above-average climate and below-median search-interest. Often the best value-for-weather trade.
What is the UV index in Auckland by month?
UV peaks at 8 (very high) in January and is lowest in June at 2 (low). Monthly peak values: Jan 8, Feb 8, Mar 6, Apr 4, May 2, Jun 2, Jul 2, Aug 2, Sep 4, Oct 5, Nov 7, Dec 8. January, December reach very high or extreme levels — apply SPF 50+, wear a hat and protective clothing, and limit direct sun between 11:00 and 17:00.
What is the UV index in Auckland in January?
January is the peak UV month in Auckland, with a daily-peak UV index of 8 (very high). At this level, sunburn can occur in under 20 minutes on unprotected fair skin. Apply SPF 50+, wear protective clothing and a hat, and avoid direct midday sun (11:00–17:00).
How high can UV get in Auckland on the sunniest days?
Most days look like the monthly average, but on the sunniest ~1 in 10 days UV climbs higher than the mean suggests. December is the worst case: typical days average UV 8 (very high), but the top 10% of days reach UV 11 (extreme) — and even higher. Months where the sunniest days routinely exceed the typical reading: January, February, March, April, May, August, October, November, December. Plan sun protection for the worst case, not the average.