Best time to visit Wellington
Re-score for me — drag the dial — every chart on the page recolours live for your heat limit 27°C
Default 27 °C is the upper edge of the Holiday Climate Index "ideal comfort" band (Scott, Rutty, Amelung & Tang, 2016). Above this, most warm-tourism travellers report measurable discomfort.
How is this scored? HCI / Steadman / CCI gate — full methodology and citations below.
Compare with another destination
Add as many as you like — stacked below the main strips above. Each row is just the recent-window score strip and (for beach destinations) sea-temperature strip.
Tours in Wellington
22 top-rated tours via Viator. Booking links earn this site a commission at no cost to you. Map locations are approximate (centred on Wellington).
- 1
 Wellington's Original LOTR Experience - includes Weta and Lunch
 - 2
 PRIVATE Wellington Half Day Tour including Cable Car
 - 3
 Martinborough Winery Private Tour
 - 4
 Half Day Tour of Wellington
 - 5
 Kapiti Island Classic Guided Day Tour
 - 6
 Discover Wellington 3 hour City Tour
 - 7
 Seal Coast Safari - Exclusive access to Wellington's secret coast
 - 8
 Wellington City to Coast Highlights Tour (with Lunch)
 - 9
 Lord of The Rings Full Day locations tour incl Weta & keepsake
 - 10
 Guided Wellington Tour by Electric Bike
 - 11
 Full Day Tour of Wellington
 - 12
 1/2 Day Guided Wellington Tour incl. Cable Car (Vans not buses)
 - 13
 Easy Rider Two-Hour Wellington eBike Tour
 - 14
 Full Day Guided Wellington Tour including guided tour at Te Papa
 - 15
 Lord of the Rings 1/2 day Tour to rule them all incl. Weta Tour
 - 16
 Full Day Martinborough Wine Tour
 - 17
 Wellington Lord of the Rings 6-8 hour Private Tour & Feast
 - 18
 Wellington City Heights Private Sightseeing 6 hour tour
 - 19
 Chefs Private Martinborough Wine Tour with lunch from Wellington
 - 20
 Wellington city heights shared sightseeing tour
 - 21
 Full Day Lord of the Rings Tour
 - 22
 Half Day Lord of the Rings Tour
Last refreshed 2026-06-06.
Similar climatesTaupo91% · Nelson91% · Dunedin91%
Other destinations with the most-alike year-round climate to Wellington (apparent temperature, rain hours, sunshine — matched within the same trip-profile). The ±N chip compares each match's typical score for the current month against Wellington's. Based on the 2020-2024 climatology, not this year's actual weather.
Month-by-month
| Month | Temp °C | Feels °C | Rain days | Rain h | Rain h/day | Humidity | Wind km/h | Sun h | UV | Interest | Score |
|---|---|---|---|---|---|---|---|---|---|---|---|
| Jan | 15–20 | 17 | 7 | 84 | 12.0 | 71% | 32 | 284 | 9 | Quiet | 8 |
| Feb | 15–20 | 17 | 9 | 107 | 11.9 | 71% | 34 | 222 | 8 | Quiet | 7 |
| Mar | 14–18 | 15 | 11 | 121 | 11.0 | 70% | 33 | 227 | 6 | Quiet | 7 |
| Apr | 13–17 | 14 | 9 | 95 | 10.6 | 73% | 31 | 195 | 3 | Quiet | 7 |
| May | 11–15 | 12 | 11 | 148 | 13.5 | 76% | 31 | 162 | 2 | Quiet | 6 |
| Jun | 10–13 | 10 | 13 | 164 | 12.6 | 79% | 31 | 133 | 1 | Quiet | 5 |
| Jul | 8–12 | 8 | 13 | 166 | 12.8 | 76% | 33 | 149 | 1 | Quiet | 5 |
| Aug | 9–12 | 8 | 13 | 170 | 13.1 | 76% | 35 | 177 | 2 | Busy | 4 |
| Sep | 9–13 | 9 | 13 | 156 | 12.0 | 74% | 38 | 195 | 3 | Moderate | 5 |
| Oct | 11–15 | 11 | 12 | 144 | 12.0 | 74% | 35 | 223 | 5 | Quiet | 5 |
| Nov | 12–17 | 13 | 12 | 167 | 13.9 | 75% | 35 | 231 | 7 | Peak | 5 |
| Dec | 14–18 | 15 | 11 | 147 | 13.4 | 76% | 35 | 250 | 8 | Peak | 6 |
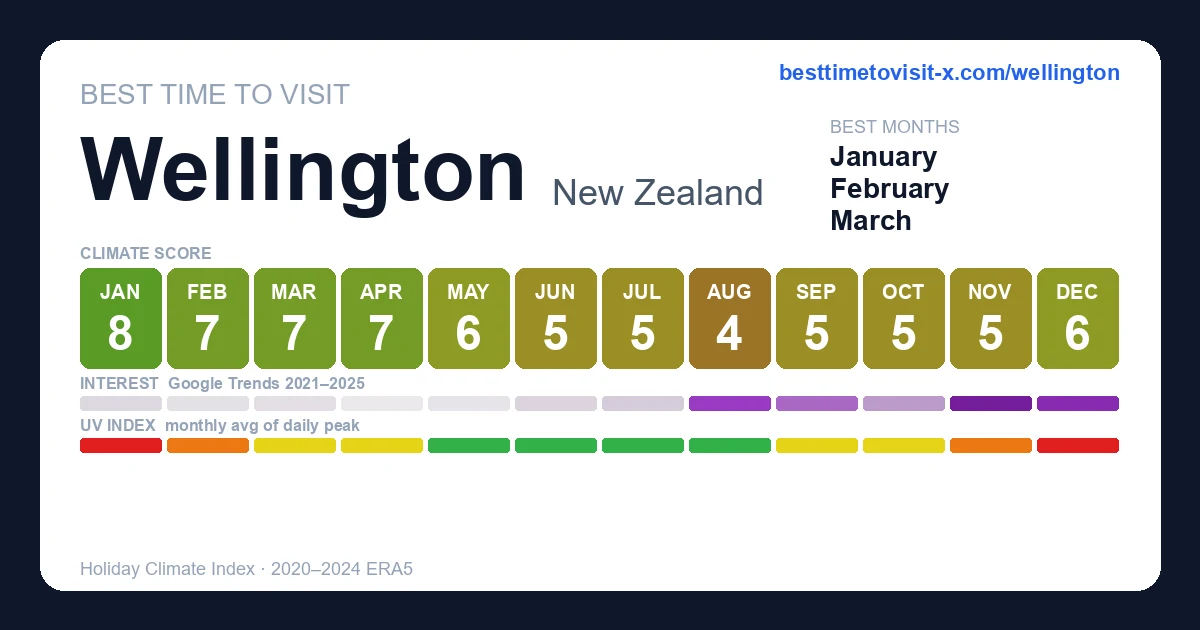
UV Index in Wellington by Month
UV index in Wellington peaks at 9 (very high) in January, dropping to 1 (low) in June. January, December reach very high or extreme levels — apply SPF 50+, wear a hat and protective clothing, and limit direct sun between 11:00 and 17:00.
Best months in detail
January
8/1015–20°C (feels 17°C) · 7 rain days (84h) · 284 sun hours · 71% humidity · Quiet crowd · UV 9 (very high) · sunniest 1 in 10 days reach 11 (very high)
February
7/1015–20°C (feels 17°C) · 9 rain days (107h) · 222 sun hours · 71% humidity · Quiet crowd · UV 8 (high) · sunniest 1 in 10 days reach 10 (very high)
April
7/1013–17°C (feels 14°C) · 9 rain days (95h) · 195 sun hours · 73% humidity · Quiet crowd · UV 3 (moderate)
Every month
Show the other 9 months in detail
March
7/1014–18°C (feels 15°C) · 11 rain days (121h) · 227 sun hours · 70% humidity · Quiet crowd · UV 6 (moderate) · sunniest 1 in 10 days reach 7 (high)
May
6/1011–15°C (feels 12°C) · 11 rain days (148h) · 162 sun hours · 76% humidity · Quiet crowd · UV 2 (low)
June
5/1010–13°C (feels 10°C) · 13 rain days (164h) · 133 sun hours · 79% humidity · Quiet crowd · UV 1 (low)
July
5/108–12°C (feels 8°C) · 13 rain days (166h) · 149 sun hours · 76% humidity · Quiet crowd · UV 1 (low)
August
4/109–12°C (feels 8°C) · 13 rain days (170h) · 177 sun hours · 76% humidity · Busy crowd · UV 2 (low)
September
5/109–13°C (feels 9°C) · 13 rain days (156h) · 195 sun hours · 74% humidity · Moderate crowd · UV 3 (moderate)
October
5/1011–15°C (feels 11°C) · 12 rain days (144h) · 223 sun hours · 74% humidity · Quiet crowd · UV 5 (moderate) · sunniest 1 in 10 days reach 7 (high)
November
5/1012–17°C (feels 13°C) · 12 rain days (167h) · 231 sun hours · 75% humidity · Peak crowd · UV 7 (high) · sunniest 1 in 10 days reach 9 (very high)
December
6/1014–18°C (feels 15°C) · 11 rain days (147h) · 250 sun hours · 76% humidity · Peak crowd · UV 8 (very high) · sunniest 1 in 10 days reach 11 (very high)
Frequently asked questions about visiting Wellington
When is the best time to visit Wellington?
January is the highest-scoring month (8/10 on the Holiday Climate Index). Typical conditions: 15–20°C (7 rainy days). The top three months by score are January, February, April.
What is the worst time to visit Wellington?
August is the lowest-scoring month (4/10). Typical conditions: 9–12°C (13 rainy days).
When are crowds lowest in Wellington?
Search-interest seasonality (Google Trends 2021-2025) is lowest in April and peaks in November. Interest tracks both in-trip visitors and lead-time planners, so treat it as a "destination is on people's minds" signal rather than literal arrivals.
Which months in Wellington have good weather but fewer tourists?
January (climate 8/10, crowd index 10) and February (climate 7/10, crowd index 5) — shoulder months with above-average climate and below-median search-interest. Often the best value-for-weather trade.
What is the UV index in Wellington by month?
UV peaks at 9 (very high) in January and is lowest in June at 1 (low). Monthly peak values: Jan 9, Feb 8, Mar 6, Apr 3, May 2, Jun 1, Jul 1, Aug 2, Sep 3, Oct 5, Nov 7, Dec 8. January, December reach very high or extreme levels — apply SPF 50+, wear a hat and protective clothing, and limit direct sun between 11:00 and 17:00.
What is the UV index in Wellington in January?
January is the peak UV month in Wellington, with a daily-peak UV index of 9 (very high). At this level, sunburn can occur in under 20 minutes on unprotected fair skin. Apply SPF 50+, wear protective clothing and a hat, and avoid direct midday sun (11:00–17:00).
How high can UV get in Wellington on the sunniest days?
Most days look like the monthly average, but on the sunniest ~1 in 10 days UV climbs higher than the mean suggests. January is the worst case: typical days average UV 9 (very high), but the top 10% of days reach UV 11 (very high) — and even higher. Months where the sunniest days routinely exceed the typical reading: January, February, March, October, November, December. Plan sun protection for the worst case, not the average.