Best time to visit Pitlochry
Re-score for me — drag the dial — every chart on the page recolours live for your heat limit 27°C
Default 27 °C is the upper edge of the Holiday Climate Index "ideal comfort" band (Scott, Rutty, Amelung & Tang, 2016). Above this, most warm-tourism travellers report measurable discomfort.
How is this scored? HCI / Steadman / CCI gate — full methodology and citations below.
Compare with another destination
Add as many as you like — stacked below the main strips above. Each row is just the recent-window score strip and (for beach destinations) sea-temperature strip.
Similar climatesStirling96% · Glasgow96% · Inverness92%
Other destinations with the most-alike year-round climate to Pitlochry (apparent temperature, rain hours, sunshine — matched within the same trip-profile). The ±N chip compares each match's typical score for the current month against Pitlochry's. Based on the 2020-2024 climatology, not this year's actual weather.
Month-by-month
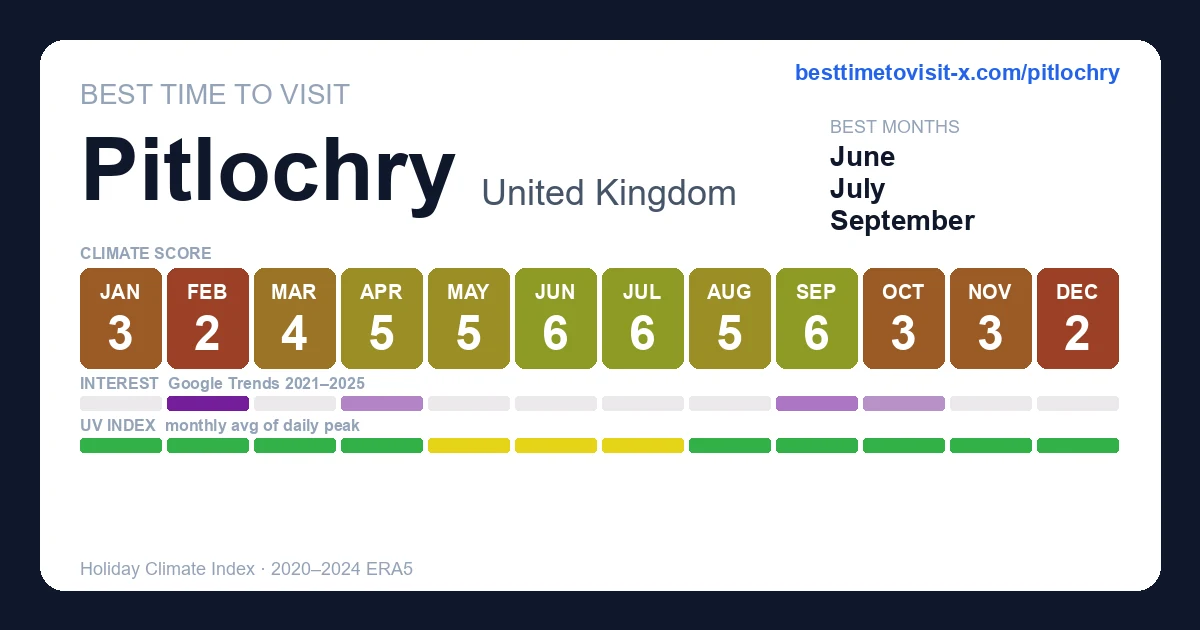
| Month | Temp °C | Feels °C | Rain days | Rain h | Rain h/day | Humidity | Wind km/h | Sun h | UV | Interest | Score |
|---|---|---|---|---|---|---|---|---|---|---|---|
| Jan | 1–6 | 2 | 15 | 185 | 12.3 | 86% | 17 | 62 | — | Quiet | 3 |
| Feb | 1–6 | 3 | 17 | 257 | 15.1 | 81% | 20 | 87 | 1 | Quiet | 2 |
| Mar | 2–8 | 5 | 16 | 200 | 12.5 | 74% | 17 | 137 | 1 | Quiet | 4 |
| Apr | 3–11 | 8 | 12 | 156 | 13.0 | 64% | 17 | 187 | 2 | Quiet | 5 |
| May | 7–15 | 12 | 17 | 206 | 12.1 | 67% | 17 | 208 | 3 | Peak | 5 |
| Jun | 10–17 | 16 | 14 | 189 | 13.5 | 65% | 16 | 230 | 4 | Busy | 6 |
| Jul | 11–18 | 17 | 16 | 225 | 14.1 | 68% | 16 | 225 | 3 | Peak | 6 |
| Aug | 11–18 | 17 | 17 | 214 | 12.6 | 71% | 16 | 202 | 3 | Peak | 5 |
| Sep | 9–16 | 15 | 13 | 168 | 12.9 | 74% | 16 | 161 | 2 | Busy | 6 |
| Oct | 7–12 | 9 | 19 | 265 | 13.9 | 81% | 18 | 91 | 1 | Busy | 3 |
| Nov | 4–8 | 6 | 14 | 195 | 13.9 | 88% | 16 | 62 | — | Quiet | 3 |
| Dec | 1–6 | 2 | 18 | 235 | 13.1 | 90% | 16 | 40 | — | Quiet | 2 |
UV Index in Pitlochry by Month
UV index in Pitlochry peaks at 4 (moderate) in June, dropping to 0 (low) in January.
Best months in detail
June
6/1010–17°C (feels 16°C) · 14 rain days (189h) · 230 sun hours · 65% humidity · Busy crowd · UV 4 (moderate) · sunniest 1 in 10 days reach 6 (moderate)
September
6/109–16°C (feels 15°C) · 13 rain days (168h) · 161 sun hours · 74% humidity · Busy crowd · UV 2 (low) · sunniest 1 in 10 days reach 3 (moderate)
July
6/1011–18°C (feels 17°C) · 16 rain days (225h) · 225 sun hours · 68% humidity · Peak crowd · UV 3 (moderate)
Every month
Show the other 9 months in detail
January
3/101–6°C (feels 2°C) · 15 rain days (185h) · 62 sun hours · 86% humidity · Quiet crowd
February
2/101–6°C (feels 3°C) · 17 rain days (257h) · 87 sun hours · 81% humidity · Quiet crowd · UV 1 (low)
March
4/102–8°C (feels 5°C) · 16 rain days (200h) · 137 sun hours · 74% humidity · Quiet crowd · UV 1 (low)
April
5/103–11°C (feels 8°C) · 12 rain days (156h) · 187 sun hours · 64% humidity · Quiet crowd · UV 2 (low) · sunniest 1 in 10 days reach 4 (moderate)
May
5/107–15°C (feels 12°C) · 17 rain days (206h) · 208 sun hours · 67% humidity · Peak crowd · UV 3 (moderate) · sunniest 1 in 10 days reach 5 (moderate)
August
5/1011–18°C (feels 17°C) · 17 rain days (214h) · 202 sun hours · 71% humidity · Peak crowd · UV 3 (low) · sunniest 1 in 10 days reach 4 (moderate)
October
3/107–12°C (feels 9°C) · 19 rain days (265h) · 91 sun hours · 81% humidity · Busy crowd · UV 1 (low)
November
3/104–8°C (feels 6°C) · 14 rain days (195h) · 62 sun hours · 88% humidity · Quiet crowd
December
2/101–6°C (feels 2°C) · 18 rain days (235h) · 40 sun hours · 90% humidity · Quiet crowd
The salmon count is disowned by the board that publishes it
Pitlochry's dam has counted salmon since the ladder opened in 1952 — thirty-four pools climbing 310 metres past an 86-metre dam, with more than a quarter of a million fish recorded crossing since.
The number itself, though, is not what visitors assume. The Tay District Salmon Fisheries Board's own annual report states plainly that the counts for 2018 to 2022 are underestimates and not to be relied on: a manual check in 2020 found roughly a third of fish were not being registered, and April 2023 was not recorded at all. The board's long chart now stitches together three incompatible methods in four years, including an AI video system originally built to identify puffins.
What the record does show cleanly is timing, and the timing has shifted: more fish now ascend in September and fewer in May.
Sources: Tay District Salmon Fisheries Board — Annual Report 2025, fish counter results , Tay District Salmon Fisheries Board — Pitlochry Dam fish counter
When can you see salmon at Pitlochry Dam?
The counted run spans March to October, with nothing recorded outside those months. The Tay board notes the run has shifted later in recent years, with a larger proportion ascending in September and fewer in May, so late summer and early autumn are now the better bet than the traditional spring advice.
Can you watch the salmon through glass at Pitlochry?
Not any more. The underwater viewing chamber that made the ladder famous has been closed on access and safety grounds since 2019, after roughly six decades in service. Visitors now watch via an underwater camera on screens inside the visitor centre. Many travel guides have not updated this.
How many salmon pass Pitlochry Dam each year?
There is no reliable current figure, and the board says so itself — counts for 2018 to 2022 are described in its annual report as underestimates not to be relied on. A 2020 manual check found about a third of fish going unregistered. Figures of 3,000 or 5,000 circulating on tourism pages are not supportable.
What is the best time to visit Pitlochry?
May to September for the theatre season and the hills, or October for the Enchanted Forest light event, which ran 8 October to 8 November in 2026. If salmon are the draw, later in the March-to-October run window is now the better bet. Winter is quiet with reduced opening across the town.
What is the Enchanted Forest?
An outdoor sound and light show staged in woodland near Pitlochry each autumn, which marked its 25th year in 2026 running 8 October to 8 November. Tickets start around GBP 28.50 for adults and include the shuttle bus. It sells out, so book well ahead of travelling.
How does the Pitlochry fish ladder work?
It is a chain of 34 pools, three of them resting chambers, climbing 310 metres alongside the 86-metre dam so migrating salmon can reach spawning grounds upstream. Built in 1952 with the hydro scheme, it has passed more than 250,000 salmon since. A counter at the top records fish as they ascend.
Is Pitlochry Festival Theatre a summer season?
Not any more. The 2026 programme ran from January to December, with productions staged sequentially in dedicated venues rather than in rotating repertory, and marked the theatre's 75th anniversary. Check the current season before assuming a summer-only schedule, which is how it is still often described.
How many days do you need in Pitlochry?
Two. One for the dam, the fish ladder and the town itself; one for the surrounding hills, Blair Castle or the Queen's View over Loch Tummel. It also works well as a base for Highland Perthshire, and it is on the main rail line, which makes arriving without a car straightforward.
What is the wettest month in Pitlochry?
Autumn and winter carry the most rain, as across Highland Perthshire, and river levels matter here more than comfort — salmon ascend on spates, so a wet spell can trigger a run. In 2025 the summer run only really started after a spate in late July, which is a useful way to think about timing.
Is Pitlochry worth visiting?
Yes, particularly as a Highland base that is easy to reach by train. The dam and ladder are genuinely interesting even with the viewing chamber closed, the theatre programmes year-round, and the Enchanted Forest is a serious autumn draw. It is small, so two days is usually enough unless you are walking.
Frequently asked questions about visiting Pitlochry
When is the best time to visit Pitlochry?
June is the highest-scoring month (6/10 on the Holiday Climate Index). Typical conditions: 10–17°C (14 rainy days). The top three months by score are June, September, July.
What is the worst time to visit Pitlochry?
December is the lowest-scoring month (2/10). Typical conditions: 1–6°C (18 rainy days).
When are crowds lowest in Pitlochry?
Search-interest seasonality (Google Trends 2021-2025) is lowest in January and peaks in May. Interest tracks both in-trip visitors and lead-time planners, so treat it as a "destination is on people's minds" signal rather than literal arrivals.
What is the UV index in Pitlochry by month?
UV peaks at 4 (moderate) in June and is lowest in January at 0 (low). Monthly peak values: Jan —, Feb 1, Mar 1, Apr 2, May 3, Jun 4, Jul 3, Aug 3, Sep 2, Oct 1, Nov —, Dec —.
What is the UV index in Pitlochry in June?
June is the peak UV month in Pitlochry, with a daily-peak UV index of 4 (moderate). Standard sun protection — sunglasses and light SPF — is recommended.
How high can UV get in Pitlochry on the sunniest days?
Most days look like the monthly average, but on the sunniest ~1 in 10 days UV climbs higher than the mean suggests. June is the worst case: typical days average UV 4 (moderate), but the top 10% of days reach UV 6 (moderate) — and even higher. Months where the sunniest days routinely exceed the typical reading: April, May, June, August, September. Plan sun protection for the worst case, not the average.