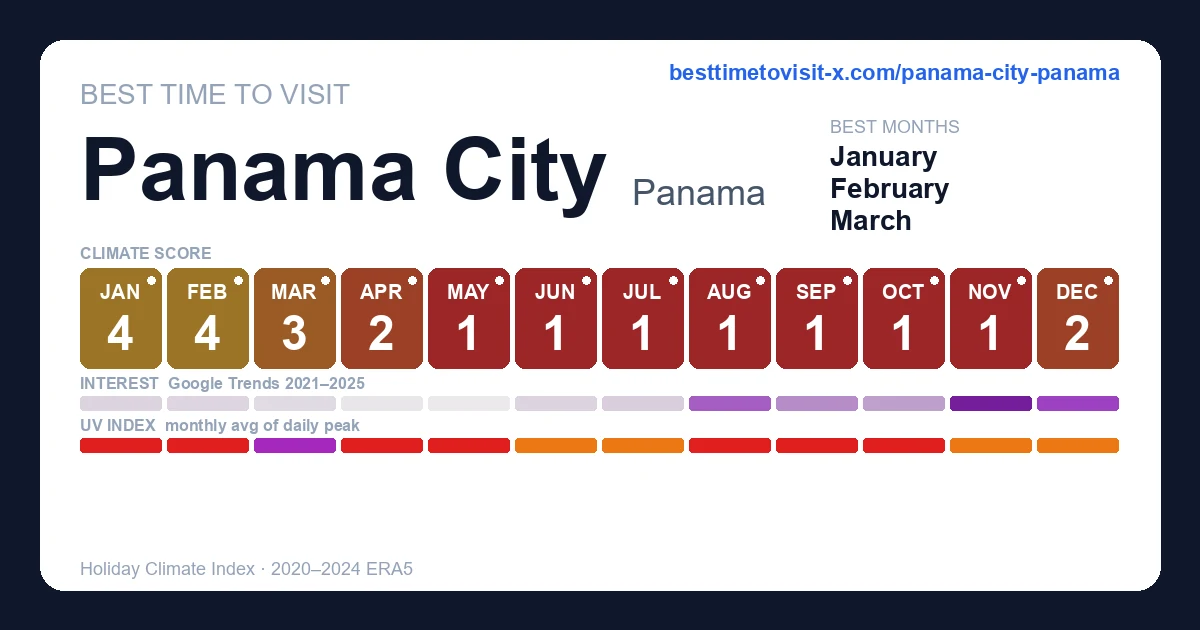
Best time to visit Panama City
Re-score for me — drag the dial — every chart on the page recolours live for your heat limit 27°C
Default 27 °C is the upper edge of the Holiday Climate Index "ideal comfort" band (Scott, Rutty, Amelung & Tang, 2016). Above this, most warm-tourism travellers report measurable discomfort.
Greyed factors are scored normally — extreme heat overrides them, so a clear sky or low rain can't lift the period.
Greyed factors are scored normally — extreme heat overrides them, so a clear sky or low rain can't lift the period.
Greyed factors are scored normally — extreme heat overrides them, so a clear sky or low rain can't lift the period.
Greyed factors are scored normally — extreme heat overrides them, so a clear sky or low rain can't lift the period.
Greyed factors are scored normally — extreme heat overrides them, so a clear sky or low rain can't lift the period.
Greyed factors are scored normally — extreme heat overrides them, so a clear sky or low rain can't lift the period.
Greyed factors are scored normally — extreme heat overrides them, so a clear sky or low rain can't lift the period.
Greyed factors are scored normally — extreme heat overrides them, so a clear sky or low rain can't lift the period.
Greyed factors are scored normally — extreme heat overrides them, so a clear sky or low rain can't lift the period.
Greyed factors are scored normally — extreme heat overrides them, so a clear sky or low rain can't lift the period.
Greyed factors are scored normally — extreme heat overrides them, so a clear sky or low rain can't lift the period.
Greyed factors are scored normally — extreme heat overrides them, so a clear sky or low rain can't lift the period.
Greyed factors are scored normally — extreme heat overrides them, so a clear sky or low rain can't lift the period.
Greyed factors are scored normally — extreme heat overrides them, so a clear sky or low rain can't lift the period.
Greyed factors are scored normally — extreme heat overrides them, so a clear sky or low rain can't lift the period.
Greyed factors are scored normally — extreme heat overrides them, so a clear sky or low rain can't lift the period.
Greyed factors are scored normally — extreme heat overrides them, so a clear sky or low rain can't lift the period.
Greyed factors are scored normally — extreme heat overrides them, so a clear sky or low rain can't lift the period.
Greyed factors are scored normally — extreme heat overrides them, so a clear sky or low rain can't lift the period.
Greyed factors are scored normally — extreme heat overrides them, so a clear sky or low rain can't lift the period.
Greyed factors are scored normally — extreme heat overrides them, so a clear sky or low rain can't lift the period.
Greyed factors are scored normally — extreme heat overrides them, so a clear sky or low rain can't lift the period.
Greyed factors are scored normally — extreme heat overrides them, so a clear sky or low rain can't lift the period.
Greyed factors are scored normally — extreme heat overrides them, so a clear sky or low rain can't lift the period.
Greyed factors are scored normally — extreme heat overrides them, so a clear sky or low rain can't lift the period.
Greyed factors are scored normally — extreme heat overrides them, so a clear sky or low rain can't lift the period.
Greyed factors are scored normally — extreme heat overrides them, so a clear sky or low rain can't lift the period.
Greyed factors are scored normally — extreme heat overrides them, so a clear sky or low rain can't lift the period.
Greyed factors are scored normally — extreme heat overrides them, so a clear sky or low rain can't lift the period.
Greyed factors are scored normally — extreme heat overrides them, so a clear sky or low rain can't lift the period.
Greyed factors are scored normally — extreme heat overrides them, so a clear sky or low rain can't lift the period.
Greyed factors are scored normally — extreme heat overrides them, so a clear sky or low rain can't lift the period.
Greyed factors are scored normally — extreme heat overrides them, so a clear sky or low rain can't lift the period.
Greyed factors are scored normally — extreme heat overrides them, so a clear sky or low rain can't lift the period.
Greyed factors are scored normally — extreme heat overrides them, so a clear sky or low rain can't lift the period.
Greyed factors are scored normally — extreme heat overrides them, so a clear sky or low rain can't lift the period.
Greyed factors are scored normally — extreme heat overrides them, so a clear sky or low rain can't lift the period.
Greyed factors are scored normally — extreme heat overrides them, so a clear sky or low rain can't lift the period.
Greyed factors are scored normally — extreme heat overrides them, so a clear sky or low rain can't lift the period.
Greyed factors are scored normally — extreme heat overrides them, so a clear sky or low rain can't lift the period.
Greyed factors are scored normally — extreme heat overrides them, so a clear sky or low rain can't lift the period.
Greyed factors are scored normally — extreme heat overrides them, so a clear sky or low rain can't lift the period.
Greyed factors are scored normally — extreme heat overrides them, so a clear sky or low rain can't lift the period.
Greyed factors are scored normally — extreme heat overrides them, so a clear sky or low rain can't lift the period.
Greyed factors are scored normally — extreme heat overrides them, so a clear sky or low rain can't lift the period.
Greyed factors are scored normally — extreme heat overrides them, so a clear sky or low rain can't lift the period.
Greyed factors are scored normally — extreme heat overrides them, so a clear sky or low rain can't lift the period.
Greyed factors are scored normally — extreme heat overrides them, so a clear sky or low rain can't lift the period.
Greyed factors are scored normally — extreme heat overrides them, so a clear sky or low rain can't lift the period.
Greyed factors are scored normally — extreme heat overrides them, so a clear sky or low rain can't lift the period.
Greyed factors are scored normally — extreme heat overrides them, so a clear sky or low rain can't lift the period.
Greyed factors are scored normally — extreme heat overrides them, so a clear sky or low rain can't lift the period.
Greyed factors are scored normally — extreme heat overrides them, so a clear sky or low rain can't lift the period.
Greyed factors are scored normally — extreme heat overrides them, so a clear sky or low rain can't lift the period.
Greyed factors are scored normally — extreme heat overrides them, so a clear sky or low rain can't lift the period.
Greyed factors are scored normally — extreme heat overrides them, so a clear sky or low rain can't lift the period.
Greyed factors are scored normally — extreme heat overrides them, so a clear sky or low rain can't lift the period.
Greyed factors are scored normally — extreme heat overrides them, so a clear sky or low rain can't lift the period.
Greyed factors are scored normally — extreme heat overrides them, so a clear sky or low rain can't lift the period.
Greyed factors are scored normally — extreme heat overrides them, so a clear sky or low rain can't lift the period.
Greyed factors are scored normally — extreme heat overrides them, so a clear sky or low rain can't lift the period.
Greyed factors are scored normally — extreme heat overrides them, so a clear sky or low rain can't lift the period.
Greyed factors are scored normally — extreme heat overrides them, so a clear sky or low rain can't lift the period.
Greyed factors are scored normally — extreme heat overrides them, so a clear sky or low rain can't lift the period.
Greyed factors are scored normally — extreme heat overrides them, so a clear sky or low rain can't lift the period.
Greyed factors are scored normally — extreme heat overrides them, so a clear sky or low rain can't lift the period.
Greyed factors are scored normally — extreme heat overrides them, so a clear sky or low rain can't lift the period.
Greyed factors are scored normally — extreme heat overrides them, so a clear sky or low rain can't lift the period.
Greyed factors are scored normally — extreme heat overrides them, so a clear sky or low rain can't lift the period.
Greyed factors are scored normally — extreme heat overrides them, so a clear sky or low rain can't lift the period.
Greyed factors are scored normally — extreme heat overrides them, so a clear sky or low rain can't lift the period.
Greyed factors are scored normally — extreme heat overrides them, so a clear sky or low rain can't lift the period.
Greyed factors are scored normally — extreme heat overrides them, so a clear sky or low rain can't lift the period.
Greyed factors are scored normally — extreme heat overrides them, so a clear sky or low rain can't lift the period.
Greyed factors are scored normally — extreme heat overrides them, so a clear sky or low rain can't lift the period.
Greyed factors are scored normally — extreme heat overrides them, so a clear sky or low rain can't lift the period.
Greyed factors are scored normally — extreme heat overrides them, so a clear sky or low rain can't lift the period.
Greyed factors are scored normally — extreme heat overrides them, so a clear sky or low rain can't lift the period.
Greyed factors are scored normally — extreme heat overrides them, so a clear sky or low rain can't lift the period.
Greyed factors are scored normally — extreme heat overrides them, so a clear sky or low rain can't lift the period.
Greyed factors are scored normally — extreme heat overrides them, so a clear sky or low rain can't lift the period.
Greyed factors are scored normally — extreme heat overrides them, so a clear sky or low rain can't lift the period.
Greyed factors are scored normally — extreme heat overrides them, so a clear sky or low rain can't lift the period.
Greyed factors are scored normally — extreme heat overrides them, so a clear sky or low rain can't lift the period.
Greyed factors are scored normally — extreme heat overrides them, so a clear sky or low rain can't lift the period.
Greyed factors are scored normally — extreme heat overrides them, so a clear sky or low rain can't lift the period.
Greyed factors are scored normally — extreme heat overrides them, so a clear sky or low rain can't lift the period.
Greyed factors are scored normally — extreme heat overrides them, so a clear sky or low rain can't lift the period.
Greyed factors are scored normally — extreme heat overrides them, so a clear sky or low rain can't lift the period.
Greyed factors are scored normally — extreme heat overrides them, so a clear sky or low rain can't lift the period.
Greyed factors are scored normally — extreme heat overrides them, so a clear sky or low rain can't lift the period.
Greyed factors are scored normally — extreme heat overrides them, so a clear sky or low rain can't lift the period.
Greyed factors are scored normally — extreme heat overrides them, so a clear sky or low rain can't lift the period.
Greyed factors are scored normally — extreme heat overrides them, so a clear sky or low rain can't lift the period.
Greyed factors are scored normally — extreme heat overrides them, so a clear sky or low rain can't lift the period.
Greyed factors are scored normally — extreme heat overrides them, so a clear sky or low rain can't lift the period.
How is this scored? HCI / Steadman / CCI gate — full methodology and citations below.
Compare with another destination
Add as many as you like — stacked below the main strips above. Each row is just the recent-window score strip and (for beach destinations) sea-temperature strip.
Tours in Panama City
20 top-rated tours via Viator. Booking links earn this site a commission at no cost to you. Map locations are approximate (centred on Panama City).
- 1
 Monkey and Sloth Jungle Habitat Panama Tour
 - 2
 Panama City Visit an Indian town Embera and waterfall with lunch
 - 3
 Monkey & Sloth Panama Canal Boat Safari with Casco Viejo Brunch
 - 4
 Ocean to Ocean Combo: Canal Boat Ride, Locks, Fort San Lorenzo
 - 5
 Half day of Panama city and canal tour: shared and private
 - 6
 Private Panama City Tour in a Classic VW Safari
 - 7
 Private or Small Group Panama Canal & City Half-Day Tour
 - 8
 Private City Tour + CANAL + Old Town + Amador + 360° VIEWS
 - 9
 EXPLORE PANAMA City 100% Private + Old Town + Canal + Poin
 - 10
 PRIVATE NIGHT TOUR in Ciudad PANAMA + 360° POIN views
 - 11
 Private Tour Old Town, Amador Causeway, Canal and Poin Panama
 - 12
 Hire Photographer, Professional Photo Shoot - Panama City
 - 13
 Panama Canal & City Tour in Half Day: Old Town & City Views
 - 14
 Gatun Lake: Monkeys & Exotic Wildlife by the Canal
 - 15
 Legends of Casco Viejo Tour: Uncover Hidden Gems
 - 16
 Tour to a waterfall and Embera village with lunch included
 - 17
 Panama City Bike Tour
 - 18
 Panama Canal and Monkey Island Tour
 - 19
 Half-day Tour of Panama City and Panama Canal
 - 20
 Full Rainforest Experience: Kayaks, Waterfall and Embera village
Last refreshed 2026-06-08.
Similar climatesDavid90% · San Jose83% · Liberia82%
Other destinations with the most-alike year-round climate to Panama City (apparent temperature, rain hours, sunshine — matched within the same trip-profile). The ±N chip compares each match's typical score for the current month against Panama City's. Based on the 2020-2024 climatology, not this year's actual weather.
Month-by-month
| Month | Temp °C | Feels °C | Rain days | Rain h | Rain h/day | Humidity | Wind km/h | Sun h | UV | Interest | Score |
|---|---|---|---|---|---|---|---|---|---|---|---|
| Jan | 24–31 | 34 | 9 | 103 | 11.4 | 63% | 18 | 251 | 9 | Quiet | 4 |
| Feb | 24–32 | 34 | 7 | 75 | 10.7 | 56% | 22 | 233 | 10 | Quiet | 4 |
| Mar | 24–32 | 34 | 14 | 119 | 8.5 | 56% | 20 | 255 | 11 | Quiet | 3 |
| Apr | 24–31 | 36 | 21 | 210 | 10.0 | 66% | 17 | 239 | 10 | Quiet | 2 |
| May | 25–30 | 35 | 28 | 334 | 11.9 | 79% | 14 | 205 | 9 | Quiet | 1 |
| Jun | 24–29 | 34 | 29 | 371 | 12.8 | 83% | 13 | 191 | 8 | Quiet | 1 |
| Jul | 24–29 | 35 | 30 | 364 | 12.1 | 83% | 14 | 175 | 8 | Quiet | 1 |
| Aug | 24–29 | 34 | 30 | 379 | 12.6 | 83% | 14 | 180 | 8 | Moderate | 1 |
| Sep | 24–29 | 34 | 30 | 356 | 11.9 | 84% | 14 | 185 | 8 | Moderate | 1 |
| Oct | 24–29 | 34 | 30 | 373 | 12.4 | 84% | 13 | 202 | 8 | Quiet | 1 |
| Nov | 24–28 | 33 | 27 | 355 | 13.1 | 85% | 15 | 185 | 7 | Peak | 1 |
| Dec | 24–30 | 34 | 19 | 203 | 10.7 | 74% | 16 | 241 | 8 | Busy | 2 |
UV Index in Panama City by Month
UV index in Panama City peaks at 11 (extreme) in March, dropping to 7 (high) in November. January, February, March, April, May, August, September, October reach very high or extreme levels — apply SPF 50+, wear a hat and protective clothing, and limit direct sun between 11:00 and 17:00.
Best months in detail
February
4/1024–32°C (feels 34°C) · 7 rain days (75h) · 233 sun hours · 56% humidity · Quiet crowd · UV 10 (very high) · sunniest 1 in 10 days reach 12 (extreme)
January
4/1024–31°C (feels 34°C) · 9 rain days (103h) · 251 sun hours · 63% humidity · Quiet crowd · UV 9 (very high)
March
3/1024–32°C (feels 34°C) · 14 rain days (119h) · 255 sun hours · 56% humidity · Quiet crowd · UV 11 (extreme)
Every month
Show the other 9 months in detail
April
2/1024–31°C (feels 36°C) · 21 rain days (210h) · 239 sun hours · 66% humidity · Quiet crowd · UV 10 (very high) · sunniest 1 in 10 days reach 12 (extreme)
May
1/1025–30°C (feels 35°C) · 28 rain days (334h) · 205 sun hours · 79% humidity · Quiet crowd · UV 9 (very high) · sunniest 1 in 10 days reach 11 (extreme)
June
1/1024–29°C (feels 34°C) · 29 rain days (371h) · 191 sun hours · 83% humidity · Quiet crowd · UV 8 (high) · sunniest 1 in 10 days reach 10 (very high)
July
1/1024–29°C (feels 35°C) · 30 rain days (364h) · 175 sun hours · 83% humidity · Quiet crowd · UV 8 (high) · sunniest 1 in 10 days reach 10 (very high)
August
1/1024–29°C (feels 34°C) · 30 rain days (379h) · 180 sun hours · 83% humidity · Moderate crowd · UV 8 (very high) · sunniest 1 in 10 days reach 11 (very high)
September
1/1024–29°C (feels 34°C) · 30 rain days (356h) · 185 sun hours · 84% humidity · Moderate crowd · UV 8 (very high) · sunniest 1 in 10 days reach 11 (very high)
October
1/1024–29°C (feels 34°C) · 30 rain days (373h) · 202 sun hours · 84% humidity · Quiet crowd · UV 8 (very high) · sunniest 1 in 10 days reach 11 (very high)
November
1/1024–28°C (feels 33°C) · 27 rain days (355h) · 185 sun hours · 85% humidity · Peak crowd · UV 7 (high) · sunniest 1 in 10 days reach 9 (very high)
December
2/1024–30°C (feels 34°C) · 19 rain days (203h) · 241 sun hours · 74% humidity · Busy crowd · UV 8 (high) · sunniest 1 in 10 days reach 9 (very high)
Frequently asked questions about visiting Panama City
When is the best time to visit Panama City?
February is the highest-scoring month (4/10 on the Holiday Climate Index). Typical conditions: 24–32°C (7 rainy days). The top three months by score are February, January, March.
What is the worst time to visit Panama City?
May is the lowest-scoring month (1/10, capped by extreme heat). Typical conditions: 25–30°C (28 rainy days).
Is Panama City too hot in summer?
12 months (January, February, March, April, May, June, July, August, September, October, November, December) trip the heat deal-breaker in our scoring: apparent temperature crosses the comfort cap, so even with clear skies and low rain the score is held down. Plan around it if heat tolerance is low.
When are crowds lowest in Panama City?
Search-interest seasonality (Google Trends 2021-2025) is lowest in May and peaks in November. Interest tracks both in-trip visitors and lead-time planners, so treat it as a "destination is on people's minds" signal rather than literal arrivals.
What is the UV index in Panama City by month?
UV peaks at 11 (extreme) in March and is lowest in November at 7 (high). Monthly peak values: Jan 9, Feb 10, Mar 11, Apr 10, May 9, Jun 8, Jul 8, Aug 8, Sep 8, Oct 8, Nov 7, Dec 8. January, February, March, April, May, August, September, October reach very high or extreme levels — apply SPF 50+, wear a hat and protective clothing, and limit direct sun between 11:00 and 17:00.
What is the UV index in Panama City in March?
March is the peak UV month in Panama City, with a daily-peak UV index of 11 (extreme). At this level, sunburn can occur in under 20 minutes on unprotected fair skin. Apply SPF 50+, wear protective clothing and a hat, and avoid direct midday sun (11:00–17:00).
How high can UV get in Panama City on the sunniest days?
Most days look like the monthly average, but on the sunniest ~1 in 10 days UV climbs higher than the mean suggests. April is the worst case: typical days average UV 10 (very high), but the top 10% of days reach UV 12 (extreme) — and even higher. Months where the sunniest days routinely exceed the typical reading: February, April, May, June, July, August, September, October, November, December. Plan sun protection for the worst case, not the average.
Is air quality in Panama City bad for travelers?
PM2.5 (fine-particle pollution) exceeds the WHO sensitive-group guideline (15 µg/m³) in 1 month: March. The worst month is March with a typical-day mean of 12 µg/m³ (moderate); on the worst 10% of days PM2.5 reaches 15 µg/m³ (unhealthy for sensitive) and higher. People with asthma, heart conditions, or sensitive children may want to avoid these months or limit outdoor activity. Source: CAMS via Open-Meteo.