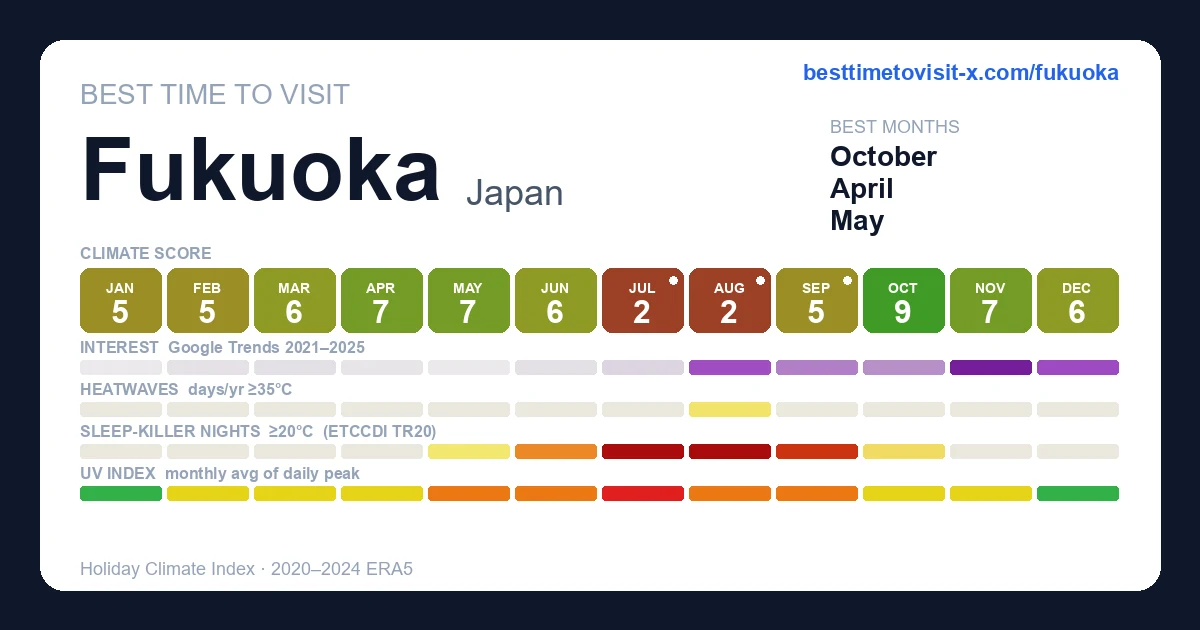
Best time to visit Fukuoka
Re-score for me — drag the dial — every chart on the page recolours live for your heat limit 27°C
Default 27 °C is the upper edge of the Holiday Climate Index "ideal comfort" band (Scott, Rutty, Amelung & Tang, 2016). Above this, most warm-tourism travellers report measurable discomfort.
Greyed factors are scored normally — extreme heat overrides them, so a clear sky or low rain can't lift the period.
Greyed factors are scored normally — extreme heat overrides them, so a clear sky or low rain can't lift the period.
Greyed factors are scored normally — extreme heat overrides them, so a clear sky or low rain can't lift the period.
Greyed factors are scored normally — extreme heat overrides them, so a clear sky or low rain can't lift the period.
Greyed factors are scored normally — extreme heat overrides them, so a clear sky or low rain can't lift the period.
Greyed factors are scored normally — extreme heat overrides them, so a clear sky or low rain can't lift the period.
Greyed factors are scored normally — extreme heat overrides them, so a clear sky or low rain can't lift the period.
Greyed factors are scored normally — extreme heat overrides them, so a clear sky or low rain can't lift the period.
Greyed factors are scored normally — extreme heat overrides them, so a clear sky or low rain can't lift the period.
Greyed factors are scored normally — extreme heat overrides them, so a clear sky or low rain can't lift the period.
Greyed factors are scored normally — extreme heat overrides them, so a clear sky or low rain can't lift the period.
Greyed factors are scored normally — extreme heat overrides them, so a clear sky or low rain can't lift the period.
Greyed factors are scored normally — extreme heat overrides them, so a clear sky or low rain can't lift the period.
Greyed factors are scored normally — extreme heat overrides them, so a clear sky or low rain can't lift the period.
Greyed factors are scored normally — extreme heat overrides them, so a clear sky or low rain can't lift the period.
Greyed factors are scored normally — extreme heat overrides them, so a clear sky or low rain can't lift the period.
Greyed factors are scored normally — extreme heat overrides them, so a clear sky or low rain can't lift the period.
Greyed factors are scored normally — extreme heat overrides them, so a clear sky or low rain can't lift the period.
Greyed factors are scored normally — extreme heat overrides them, so a clear sky or low rain can't lift the period.
Greyed factors are scored normally — extreme heat overrides them, so a clear sky or low rain can't lift the period.
Greyed factors are scored normally — extreme heat overrides them, so a clear sky or low rain can't lift the period.
Greyed factors are scored normally — extreme heat overrides them, so a clear sky or low rain can't lift the period.
How is this scored? HCI / Steadman / CCI gate — full methodology and citations below.
Compare with another destination
Add as many as you like — stacked below the main strips above. Each row is just the recent-window score strip and (for beach destinations) sea-temperature strip.
Tours in Fukuoka
14 top-rated tours via Viator. Booking links earn this site a commission at no cost to you. Map locations are approximate (centred on Fukuoka).
- 1
 Northern Kyushu Day Tour Akiyoshido Cave and Motonosumi Inari
 - 2
 Fukuoka: Mt.Aso, Miyazaki, Takachiho Gorge with Beef Lunch Tour
 - 3
 Fukuoka Day Trip to Yufuin, Beppu Hell Onsen and Animal Park
 - 4
 Yamaguchi Akiyoshido Cave and Shrine Day Tour From Fukuoka
 - 5
 Fukuoka Japanese Home Cooking: Ginger Pork
 - 6
 Kyushu Full Day Tour with Dazaifu Shrine,Cable car and Yufuin
 - 7
 Home Made Maki Sushi Class in Fukuoka
 - 8
 Hakata Old Town Walking Tour Tracing the True History of Fukuoka
 - 9
 Fukuoka: Local Ramen Experience in Downtown Fukuoka
 - 10
 Fukuoka: Mount Aso Volcano, Kumamoto Castle, Grasslands Day Tour
 - 11
 Fukuoka: Nakasu Food Stall Private Guided Tour with Tastings
 - 12
 Kyushu Day Tour:Aso Boy Scenic Train, Aso Volcano,Kumamoto Castle
 - 13
 Kyushu: Aso Vocano, Grassland,Onsen and Aso shrine 1-Day Tour
 - 14
 Fukuoka Hakata Sake and Gastronomic Delicacies Tour
Last refreshed 2026-05-26.
Similar climatesKyoto93% · Nara93% · Nagoya92%
Other destinations with the most-alike year-round climate to Fukuoka (apparent temperature, rain hours, sunshine — matched within the same trip-profile). The ±N chip compares each match's typical score for the current month against Fukuoka's. Based on the 2020-2024 climatology, not this year's actual weather.
Month-by-month
| Month | Temp °C | Feels °C | Rain days | Rain h | Rain h/day | Humidity | Wind km/h | Sun h | UV | Interest | Score |
|---|---|---|---|---|---|---|---|---|---|---|---|
| Jan | 4–9 | 6 | 13 | 160 | 12.3 | 64% | 20 | 142 | 2 | Quiet | 5 |
| Feb | 4–11 | 7 | 11 | 140 | 12.7 | 63% | 20 | 152 | 3 | Quiet | 5 |
| Mar | 7–15 | 12 | 12 | 151 | 12.6 | 63% | 20 | 177 | 4 | Quiet | 6 |
| Apr | 11–18 | 16 | 11 | 134 | 12.2 | 62% | 19 | 187 | 5 | Quiet | 7 |
| May | 15–22 | 22 | 12 | 158 | 13.2 | 65% | 18 | 203 | 7 | Quiet | 7 |
| Jun | 20–26 | 28 | 15 | 201 | 13.4 | 73% | 17 | 183 | 6 | Quiet | 6 |
| Jul | 24–30 | 34 | 20 | 247 | 12.3 | 71% | 17 | 206 | 8 | Quiet | 2 |
| Aug | 25–31 | 36 | 18 | 225 | 12.5 | 68% | 17 | 241 | 8 | Busy | 2 |
| Sep | 22–28 | 30 | 14 | 184 | 13.1 | 70% | 19 | 200 | 6 | Moderate | 5 |
| Oct | 15–22 | 22 | 9 | 99 | 11.0 | 62% | 18 | 198 | 5 | Moderate | 9 |
| Nov | 11–18 | 16 | 9 | 108 | 12.0 | 62% | 18 | 173 | 3 | Peak | 7 |
| Dec | 5–11 | 7 | 10 | 115 | 11.5 | 60% | 20 | 155 | 2 | Busy | 6 |
UV Index in Fukuoka by Month
UV index in Fukuoka peaks at 8 (very high) in July, dropping to 2 (low) in December. July reach very high or extreme levels — apply SPF 50+, wear a hat and protective clothing, and limit direct sun between 11:00 and 17:00.
Best months in detail
October
9/1015–22°C · 9 rain days (99h) · 198 sun hours · 62% humidity · Moderate crowd · UV 5 (moderate) · sunniest 1 in 10 days reach 6 (high)
November
7/1011–18°C (feels 16°C) · 9 rain days (108h) · 173 sun hours · 62% humidity · Peak crowd · UV 3 (moderate)
May
7/1015–22°C · 12 rain days (158h) · 203 sun hours · 65% humidity · Quiet crowd · UV 7 (high) · sunniest 1 in 10 days reach 9 (very high)
Every month
Show the other 9 months in detail
January
5/104–9°C (feels 6°C) · 13 rain days (160h) · 142 sun hours · 64% humidity · Quiet crowd · UV 2 (low) · sunniest 1 in 10 days reach 3 (moderate)
February
5/104–11°C (feels 7°C) · 11 rain days (140h) · 152 sun hours · 63% humidity · Quiet crowd · UV 3 (moderate)
March
6/107–15°C (feels 12°C) · 12 rain days (151h) · 177 sun hours · 63% humidity · Quiet crowd · UV 4 (moderate) · sunniest 1 in 10 days reach 6 (high)
April
7/1011–18°C (feels 16°C) · 11 rain days (134h) · 187 sun hours · 62% humidity · Quiet crowd · UV 5 (moderate) · sunniest 1 in 10 days reach 8 (very high)
June
6/1020–26°C (feels 28°C) · 15 rain days (201h) · 183 sun hours · 73% humidity · Quiet crowd · UV 6 (high) · sunniest 1 in 10 days reach 9 (very high)
July
2/1024–30°C (feels 34°C) · 20 rain days (247h) · 206 sun hours · 71% humidity · Quiet crowd · UV 8 (very high) · sunniest 1 in 10 days reach 10 (very high)
August
2/1025–31°C (feels 36°C) · 18 rain days (225h) · 241 sun hours · 68% humidity · Busy crowd · UV 8 (high) · sunniest 1 in 10 days reach 10 (very high)
September
5/1022–28°C (feels 30°C) · 14 rain days (184h) · 200 sun hours · 70% humidity · Moderate crowd · UV 6 (high) · sunniest 1 in 10 days reach 8 (very high)
December
6/105–11°C (feels 7°C) · 10 rain days (115h) · 155 sun hours · 60% humidity · Busy crowd · UV 2 (low)
Frequently asked questions about visiting Fukuoka
When is the best time to visit Fukuoka?
October is the highest-scoring month (9/10 on the Holiday Climate Index). Typical conditions: 15–22°C (9 rainy days). The top three months by score are October, November, May.
What is the worst time to visit Fukuoka?
August is the lowest-scoring month (2/10, capped by extreme heat). Typical conditions: 25–31°C (18 rainy days).
Is Fukuoka too hot in summer?
3 months (July, August, September) trip the heat deal-breaker in our scoring: apparent temperature crosses the comfort cap, so even with clear skies and low rain the score is held down. Plan around it if heat tolerance is low.
When are crowds lowest in Fukuoka?
Search-interest seasonality (Google Trends 2021-2025) is lowest in January and peaks in November. Interest tracks both in-trip visitors and lead-time planners, so treat it as a "destination is on people's minds" signal rather than literal arrivals.
Which months in Fukuoka have good weather but fewer tourists?
October (climate 9/10, crowd index 44) and April (climate 7/10, crowd index 2) — shoulder months with above-average climate and below-median search-interest. Often the best value-for-weather trade.
What is the UV index in Fukuoka by month?
UV peaks at 8 (very high) in July and is lowest in December at 2 (low). Monthly peak values: Jan 2, Feb 3, Mar 4, Apr 5, May 7, Jun 6, Jul 8, Aug 8, Sep 6, Oct 5, Nov 3, Dec 2. July reach very high or extreme levels — apply SPF 50+, wear a hat and protective clothing, and limit direct sun between 11:00 and 17:00.
What is the UV index in Fukuoka in July?
July is the peak UV month in Fukuoka, with a daily-peak UV index of 8 (very high). At this level, sunburn can occur in under 20 minutes on unprotected fair skin. Apply SPF 50+, wear protective clothing and a hat, and avoid direct midday sun (11:00–17:00).
How high can UV get in Fukuoka on the sunniest days?
Most days look like the monthly average, but on the sunniest ~1 in 10 days UV climbs higher than the mean suggests. July is the worst case: typical days average UV 8 (very high), but the top 10% of days reach UV 10 (very high) — and even higher. Months where the sunniest days routinely exceed the typical reading: January, March, April, May, June, July, August, September, October. Plan sun protection for the worst case, not the average.
Is air quality in Fukuoka bad for travelers?
PM2.5 (fine-particle pollution) exceeds the WHO sensitive-group guideline (15 µg/m³) in 12 months: January, February, March, April, May, June, July, August, September, October, November, December. The worst month is April with a typical-day mean of 19 µg/m³ (unhealthy for sensitive); on the worst 10% of days PM2.5 reaches 28 µg/m³ (unhealthy) and higher. People with asthma, heart conditions, or sensitive children may want to avoid these months or limit outdoor activity. Source: CAMS via Open-Meteo.