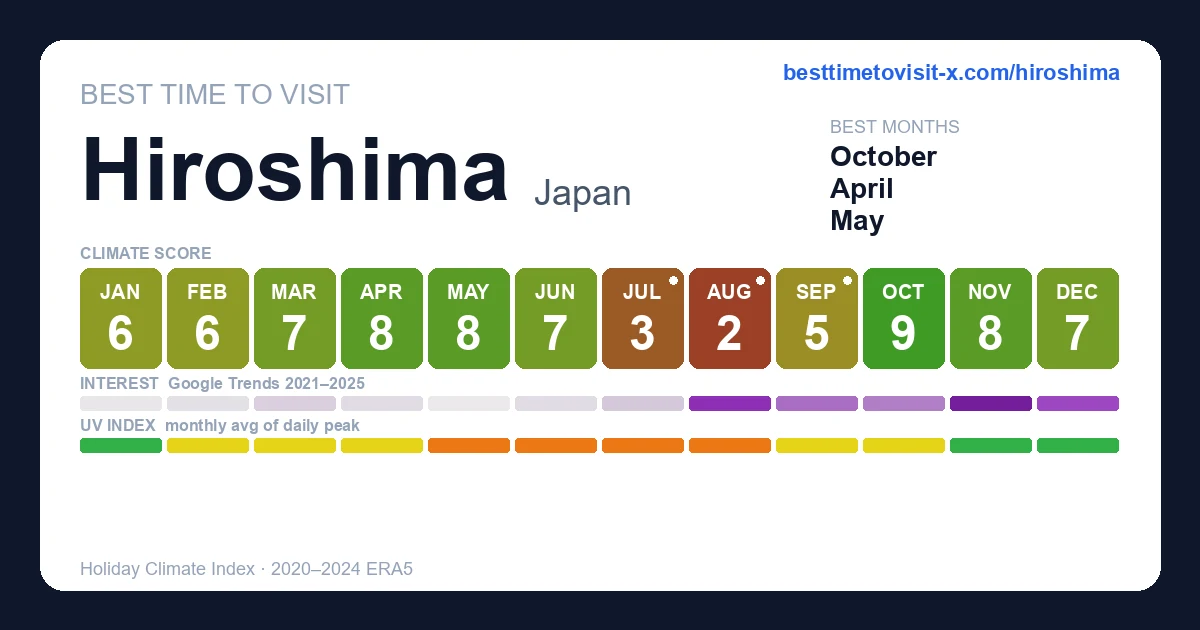
Best time to visit Hiroshima
Re-score for me — drag the dial — every chart on the page recolours live for your heat limit 27°C
Default 27 °C is the upper edge of the Holiday Climate Index "ideal comfort" band (Scott, Rutty, Amelung & Tang, 2016). Above this, most warm-tourism travellers report measurable discomfort.
Greyed factors are scored normally — extreme heat overrides them, so a clear sky or low rain can't lift the period.
Greyed factors are scored normally — extreme heat overrides them, so a clear sky or low rain can't lift the period.
Greyed factors are scored normally — extreme heat overrides them, so a clear sky or low rain can't lift the period.
Greyed factors are scored normally — extreme heat overrides them, so a clear sky or low rain can't lift the period.
Greyed factors are scored normally — extreme heat overrides them, so a clear sky or low rain can't lift the period.
Greyed factors are scored normally — extreme heat overrides them, so a clear sky or low rain can't lift the period.
Greyed factors are scored normally — extreme heat overrides them, so a clear sky or low rain can't lift the period.
Greyed factors are scored normally — extreme heat overrides them, so a clear sky or low rain can't lift the period.
Greyed factors are scored normally — extreme heat overrides them, so a clear sky or low rain can't lift the period.
Greyed factors are scored normally — extreme heat overrides them, so a clear sky or low rain can't lift the period.
Greyed factors are scored normally — extreme heat overrides them, so a clear sky or low rain can't lift the period.
Greyed factors are scored normally — extreme heat overrides them, so a clear sky or low rain can't lift the period.
Greyed factors are scored normally — extreme heat overrides them, so a clear sky or low rain can't lift the period.
Greyed factors are scored normally — extreme heat overrides them, so a clear sky or low rain can't lift the period.
Greyed factors are scored normally — extreme heat overrides them, so a clear sky or low rain can't lift the period.
Greyed factors are scored normally — extreme heat overrides them, so a clear sky or low rain can't lift the period.
Greyed factors are scored normally — extreme heat overrides them, so a clear sky or low rain can't lift the period.
Greyed factors are scored normally — extreme heat overrides them, so a clear sky or low rain can't lift the period.
Greyed factors are scored normally — extreme heat overrides them, so a clear sky or low rain can't lift the period.
Greyed factors are scored normally — extreme heat overrides them, so a clear sky or low rain can't lift the period.
How is this scored? HCI / Steadman / CCI gate — full methodology and citations below.
Compare with another destination
Add as many as you like — stacked below the main strips above. Each row is just the recent-window score strip and (for beach destinations) sea-temperature strip.
Tours in Hiroshima
16 top-rated tours via Viator. Booking links earn this site a commission at no cost to you. Map locations are approximate (centred on Hiroshima).
- 1
 Hiroshima Highlights Guided Tour in 5.5 hours
 - 2
 Hiroshima: Atomic Bomb Dome and Peace Memorial Museum 3 hours
 - 3
 Hiroshima & Miyajima All-Inclusive Tour w/Licensed guide Pancho
 - 4
 Hiroshima / Miyajima Full-day Private Tour with Government Licensed Guide
 - 5
 Hiroshima City 4hr Private Walking Tour with Licensed Guide
 - 6
 Foodie Bike Tour in Hiroshima Taste Local Delights
 - 7
 Iwakuni Tour from Hiroshima with Sake Tasting and Sushi Making
 - 8
 Hiroshima Night Tour: Craft Beer and Local Bites
 - 9
 Hiroshima Peace Memorial and Atomic Bomb Dome Private Tour
 - 10
 Field Archery Experience in Hiroshima, Japan
 - 11
 Peaceful Hiroshima & Miyajima UNESCO 1 Day Bus Tour
 - 12
 Hiroshima Peace & History Tour: Why the Atomic Bomb Was Dropped
 - 13
 Hiroshima and Miyajima Day Trip with Itsukushima Shrine & Ferry
 - 14
 Hiroshima in a Nutshell: Morning Bike Adventure
 - 15
 Hiroshima Peace (Heiwa) Walking Tour at World Heritage Sites
 - 16
 Private Full Day Hiroshima Tour
Last refreshed 2026-05-30.
Similar climatesOsaka96% · Kobe96% · Kyoto95%
Other destinations with the most-alike year-round climate to Hiroshima (apparent temperature, rain hours, sunshine — matched within the same trip-profile). The ±N chip compares each match's typical score for the current month against Hiroshima's. Based on the 2020-2024 climatology, not this year's actual weather.
Month-by-month
| Month | Temp °C | Feels °C | Rain days | Rain h | Rain h/day | Humidity | Wind km/h | Sun h | UV | Interest | Score |
|---|---|---|---|---|---|---|---|---|---|---|---|
| Jan | 1–9 | 6 | 7 | 79 | 11.3 | 58% | 16 | 166 | 2 | Quiet | 6 |
| Feb | 1–10 | 7 | 7 | 91 | 13.0 | 58% | 16 | 165 | 3 | Quiet | 6 |
| Mar | 4–14 | 12 | 11 | 119 | 10.8 | 60% | 16 | 187 | 4 | Quiet | 7 |
| Apr | 8–18 | 16 | 9 | 115 | 12.8 | 60% | 15 | 192 | 5 | Quiet | 8 |
| May | 13–22 | 22 | 10 | 127 | 12.7 | 65% | 15 | 211 | 7 | Quiet | 8 |
| Jun | 18–25 | 28 | 14 | 174 | 12.4 | 73% | 14 | 192 | 6 | Quiet | 7 |
| Jul | 23–29 | 33 | 17 | 233 | 13.7 | 76% | 15 | 209 | 8 | Quiet | 3 |
| Aug | 24–31 | 35 | 13 | 189 | 14.5 | 68% | 15 | 234 | 7 | Busy | 2 |
| Sep | 21–29 | 31 | 12 | 145 | 12.1 | 66% | 14 | 204 | 6 | Moderate | 5 |
| Oct | 13–22 | 22 | 7 | 70 | 10.0 | 59% | 14 | 197 | 4 | Moderate | 9 |
| Nov | 8–17 | 15 | 6 | 58 | 9.7 | 60% | 14 | 188 | 3 | Peak | 8 |
| Dec | 2–11 | 7 | 4 | 52 | 13.0 | 57% | 16 | 185 | 2 | Busy | 7 |
UV Index in Hiroshima by Month
UV index in Hiroshima peaks at 8 (high) in July, dropping to 2 (low) in December. May, June, July, August have high UV — SPF 30+ and sunglasses recommended.
Best months in detail
October
9/1013–22°C · 7 rain days (70h) · 197 sun hours · 59% humidity · Moderate crowd · UV 4 (moderate) · sunniest 1 in 10 days reach 6 (high)
November
8/108–17°C (feels 15°C) · 6 rain days (58h) · 188 sun hours · 60% humidity · Peak crowd · UV 3 (low) · sunniest 1 in 10 days reach 4 (moderate)
May
8/1013–22°C · 10 rain days (127h) · 211 sun hours · 65% humidity · Quiet crowd · UV 7 (high) · sunniest 1 in 10 days reach 9 (very high)
Every month
Show the other 9 months in detail
January
6/101–9°C (feels 6°C) · 7 rain days (79h) · 166 sun hours · 58% humidity · Quiet crowd · UV 2 (low)
February
6/101–10°C (feels 7°C) · 7 rain days (91h) · 165 sun hours · 58% humidity · Quiet crowd · UV 3 (moderate) · sunniest 1 in 10 days reach 5 (moderate)
March
7/104–14°C (feels 12°C) · 11 rain days (119h) · 187 sun hours · 60% humidity · Quiet crowd · UV 4 (moderate) · sunniest 1 in 10 days reach 6 (moderate)
April
8/108–18°C (feels 16°C) · 9 rain days (115h) · 192 sun hours · 60% humidity · Quiet crowd · UV 5 (moderate) · sunniest 1 in 10 days reach 8 (high)
June
7/1018–25°C (feels 28°C) · 14 rain days (174h) · 192 sun hours · 73% humidity · Quiet crowd · UV 6 (high) · sunniest 1 in 10 days reach 9 (very high)
July
3/1023–29°C (feels 33°C) · 17 rain days (233h) · 209 sun hours · 76% humidity · Quiet crowd · UV 8 (high) · sunniest 1 in 10 days reach 10 (very high)
August
2/1024–31°C (feels 35°C) · 13 rain days (189h) · 234 sun hours · 68% humidity · Busy crowd · UV 7 (high) · sunniest 1 in 10 days reach 10 (very high)
September
5/1021–29°C (feels 31°C) · 12 rain days (145h) · 204 sun hours · 66% humidity · Moderate crowd · UV 6 (moderate) · sunniest 1 in 10 days reach 8 (high)
December
7/102–11°C (feels 7°C) · 4 rain days (52h) · 185 sun hours · 57% humidity · Busy crowd · UV 2 (low)
Frequently asked questions about visiting Hiroshima
When is the best time to visit Hiroshima?
October is the highest-scoring month (9/10 on the Holiday Climate Index). Typical conditions: 13–22°C (7 rainy days). The top three months by score are October, November, May.
What is the worst time to visit Hiroshima?
August is the lowest-scoring month (2/10, capped by extreme heat). Typical conditions: 24–31°C (13 rainy days).
Is Hiroshima too hot in summer?
3 months (July, August, September) trip the heat deal-breaker in our scoring: apparent temperature crosses the comfort cap, so even with clear skies and low rain the score is held down. Plan around it if heat tolerance is low.
When are crowds lowest in Hiroshima?
Search-interest seasonality (Google Trends 2021-2025) is lowest in May and peaks in November. Interest tracks both in-trip visitors and lead-time planners, so treat it as a "destination is on people's minds" signal rather than literal arrivals.
Which months in Hiroshima have good weather but fewer tourists?
April (climate 8/10, crowd index 7) and May (climate 8/10, crowd index 0) — shoulder months with above-average climate and below-median search-interest. Often the best value-for-weather trade.
What is the UV index in Hiroshima by month?
UV peaks at 8 (high) in July and is lowest in December at 2 (low). Monthly peak values: Jan 2, Feb 3, Mar 4, Apr 5, May 7, Jun 6, Jul 8, Aug 7, Sep 6, Oct 4, Nov 3, Dec 2.
What is the UV index in Hiroshima in July?
July is the peak UV month in Hiroshima, with a daily-peak UV index of 8 (high). Apply SPF 30+, wear sunglasses, and seek shade during midday hours.
How high can UV get in Hiroshima on the sunniest days?
Most days look like the monthly average, but on the sunniest ~1 in 10 days UV climbs higher than the mean suggests. July is the worst case: typical days average UV 8 (high), but the top 10% of days reach UV 10 (very high) — and even higher. Months where the sunniest days routinely exceed the typical reading: February, March, April, May, June, July, August, September, October, November. Plan sun protection for the worst case, not the average.
Is air quality in Hiroshima bad for travelers?
PM2.5 (fine-particle pollution) exceeds the WHO sensitive-group guideline (15 µg/m³) in 10 months: January, February, March, April, May, June, July, August, November, December. The worst month is March with a typical-day mean of 17 µg/m³ (unhealthy for sensitive); on the worst 10% of days PM2.5 reaches 28 µg/m³ (unhealthy) and higher. People with asthma, heart conditions, or sensitive children may want to avoid these months or limit outdoor activity. Source: CAMS via Open-Meteo.