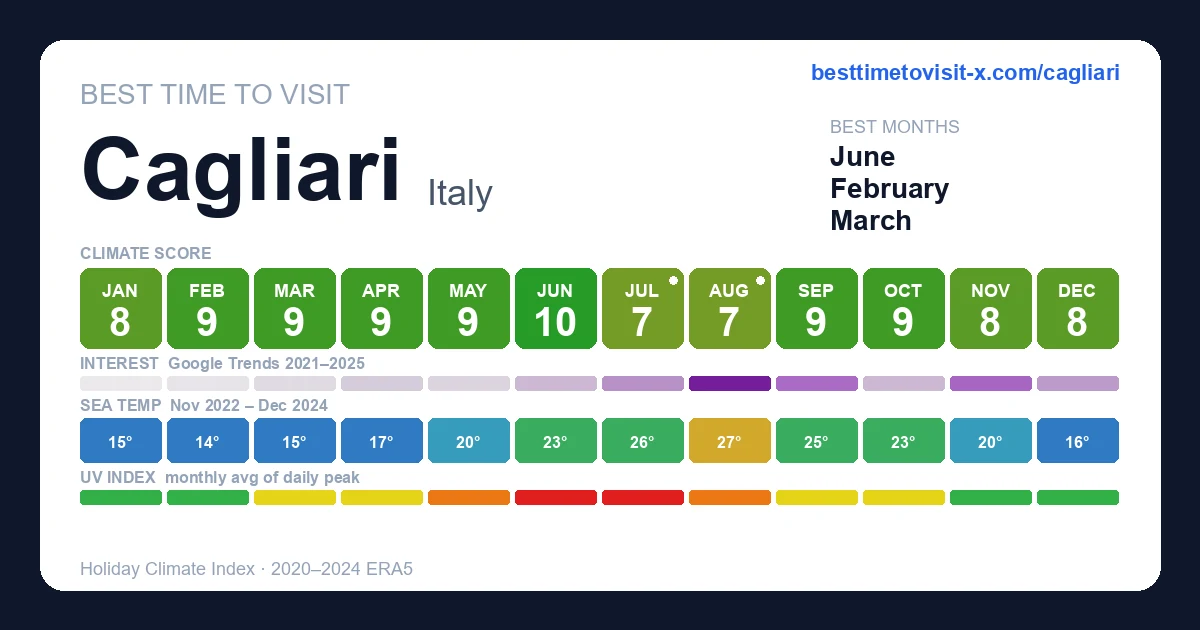
Best time to visit Cagliari
Re-score for me — drag the dial — every chart recolours live for your heat & sea limits 27°C · sea 29°C
Default 27 °C is the upper edge of the Holiday Climate Index "ideal comfort" band (Scott, Rutty, Amelung & Tang, 2016). Above this, most warm-tourism travellers report measurable discomfort.
Default 29 °C is the Beach Climate Index "bathtub" line (Morgan et al.) — where the sea stops being refreshing and starts feeling like a warm bath.
Greyed factors are scored normally — extreme heat overrides them, so a clear sky or low rain can't lift the period.
Greyed factors are scored normally — extreme heat overrides them, so a clear sky or low rain can't lift the period.
Greyed factors are scored normally — extreme heat overrides them, so a clear sky or low rain can't lift the period.
Greyed factors are scored normally — extreme heat overrides them, so a clear sky or low rain can't lift the period.
Greyed factors are scored normally — extreme heat overrides them, so a clear sky or low rain can't lift the period.
Greyed factors are scored normally — extreme heat overrides them, so a clear sky or low rain can't lift the period.
Greyed factors are scored normally — extreme heat overrides them, so a clear sky or low rain can't lift the period.
Greyed factors are scored normally — extreme heat overrides them, so a clear sky or low rain can't lift the period.
Greyed factors are scored normally — extreme heat overrides them, so a clear sky or low rain can't lift the period.
Greyed factors are scored normally — extreme heat overrides them, so a clear sky or low rain can't lift the period.
Greyed factors are scored normally — extreme heat overrides them, so a clear sky or low rain can't lift the period.
Greyed factors are scored normally — extreme heat overrides them, so a clear sky or low rain can't lift the period.
Greyed factors are scored normally — extreme heat overrides them, so a clear sky or low rain can't lift the period.
Greyed factors are scored normally — extreme heat overrides them, so a clear sky or low rain can't lift the period.
Greyed factors are scored normally — extreme heat overrides them, so a clear sky or low rain can't lift the period.
Greyed factors are scored normally — extreme heat overrides them, so a clear sky or low rain can't lift the period.
Greyed factors are scored normally — extreme heat overrides them, so a clear sky or low rain can't lift the period.
Greyed factors are scored normally — extreme heat overrides them, so a clear sky or low rain can't lift the period.
How is this scored? HCI / Steadman / CCI gate — full methodology and citations below.
Compare with another destination
Add as many as you like — stacked below the main strips above. Each row is just the recent-window score strip and (for beach destinations) sea-temperature strip.
Tours in Cagliari
19 top-rated tours via Viator. Booking links earn this site a commission at no cost to you.
- 1
 Private Fresh Pasta Class at Local Home in Cagliari
 - 2
 Cagliari: San Pietro Island and Carloforte Private Experience
 - 3
 Private Cooking Class at Local Home in Cagliari
 - 4
 Cagliari: Day Trip to Cave of Neptune Private Experience
 - 5
 Authentic Sardinian Stuffed Pasta Cooking Class at a Local Home
 - 6
 Barumini Unesco Site and Giara of Gesturi Tour from Cagliari
 - 7
 SU NURAXI BARUMINI Unesco World Heritage Site
 - 8
 WINE TOUR with sommelier in a winery near Cagliari
 - 9
 Winery And Oil Mill Tasting Tour
 - 10
 Boat Tour in Cagliari Saddle of the Devil Stops Swimming Snorkeling
 - 11
 Boat tour Saddle of the Devil Aperitif and Serenade with Violinist
 - 12
 Cagliari City Tour - Minivan Sightseeing and Walking
 - 13
 Private Half-Day Trip from Cagliari to Nora Ruins
 - 14
 Full Day Sardinia Blue Zone Tour - The Family Experience
 - 15
 Sardinia Cooking Class: Culurgiones and Panadas in Cagliari
 - 16
 Full Day-Small group: Barbagia Experience: Mamoiada and Orgosolo from Cagliari
 - 17
 Private Cheese Making and Tasting Tour from Cagliari - with Lunch
 - 18
 Cagliari: Amazing Bosa and Prehistoric Sardinia
 - 19
 Cagliari: Castelsardo and the Sardinian Pyramide
Last refreshed 2026-06-10.
Similar climatesOlbia95% · Hydra95% · Spetses95%
Other destinations with the most-alike year-round climate to Cagliari (apparent temperature, rain hours, sunshine — matched within the same trip-profile). The ±N chip compares each match's typical score for the current month against Cagliari's. Based on the 2020-2024 climatology, not this year's actual weather.
Month-by-month
| Month | Temp °C | Feels °C | Rain days | Rain h | Rain h/day | Humidity | Wind km/h | Sun h | UV | Interest | Score |
|---|---|---|---|---|---|---|---|---|---|---|---|
| Jan | 8–14 | 12 | 9 | 87 | 9.7 | 71% | 21 | 184 | 2 | Quiet | 8 |
| Feb | 9–16 | 13 | 4 | 45 | 11.3 | 65% | 21 | 199 | 3 | Quiet | 9 |
| Mar | 10–16 | 14 | 7 | 65 | 9.3 | 63% | 22 | 229 | 4 | Quiet | 9 |
| Apr | 11–19 | 17 | 7 | 75 | 10.7 | 57% | 23 | 249 | 6 | Quiet | 9 |
| May | 15–23 | 22 | 7 | 71 | 10.1 | 57% | 21 | 272 | 7 | Quiet | 9 |
| Jun | 20–28 | 28 | 3 | 22 | 7.3 | 50% | 22 | 294 | 8 | Quiet | 10 |
| Jul | 23–32 | 32 | 0 | 5 | — | 46% | 23 | 312 | 9 | Moderate | 7 |
| Aug | 23–32 | 32 | 1 | 10 | 10.0 | 47% | 23 | 295 | 8 | Peak | 7 |
| Sep | 20–28 | 28 | 5 | 46 | 9.2 | 54% | 21 | 249 | 6 | Moderate | 9 |
| Oct | 17–24 | 23 | 6 | 59 | 9.8 | 60% | 19 | 216 | 4 | Quiet | 9 |
| Nov | 13–19 | 18 | 9 | 94 | 10.4 | 66% | 19 | 183 | 2 | Moderate | 8 |
| Dec | 10–16 | 14 | 7 | 73 | 10.4 | 70% | 20 | 179 | 2 | Quiet | 8 |
UV Index in Cagliari by Month
UV index in Cagliari peaks at 9 (very high) in July, dropping to 2 (low) in December. June, July reach very high or extreme levels — apply SPF 50+, wear a hat and protective clothing, and limit direct sun between 11:00 and 17:00.
Best months in detail
June
10/1020–28°C · 3 rain days (22h) · 294 sun hours · 50% humidity · Quiet crowd · UV 8 (very high)
October
9/1017–24°C · 6 rain days (59h) · 216 sun hours · 60% humidity · Quiet crowd · UV 4 (moderate)
May
9/1015–23°C (feels 22°C) · 7 rain days (71h) · 272 sun hours · 57% humidity · Quiet crowd · UV 7 (high)
Every month
Show the other 9 months in detail
January
8/108–14°C (feels 12°C) · 9 rain days (87h) · 184 sun hours · 71% humidity · Quiet crowd · UV 2 (low)
February
9/109–16°C (feels 13°C) · 4 rain days (45h) · 199 sun hours · 65% humidity · Quiet crowd · UV 3 (low) · sunniest 1 in 10 days reach 4 (moderate)
March
9/1010–16°C (feels 14°C) · 7 rain days (65h) · 229 sun hours · 63% humidity · Quiet crowd · UV 4 (moderate)
April
9/1011–19°C (feels 17°C) · 7 rain days (75h) · 249 sun hours · 57% humidity · Quiet crowd · UV 6 (moderate) · sunniest 1 in 10 days reach 7 (high)
July
7/1023–32°C · 0 rain days (5h) · 312 sun hours · 46% humidity · Moderate crowd · UV 9 (very high)
August
7/1023–32°C · 1 rain days (10h) · 295 sun hours · 47% humidity · Peak crowd · UV 8 (high) · sunniest 1 in 10 days reach 9 (very high)
September
9/1020–28°C · 5 rain days (46h) · 249 sun hours · 54% humidity · Moderate crowd · UV 6 (moderate) · sunniest 1 in 10 days reach 7 (high)
November
8/1013–19°C (feels 18°C) · 9 rain days (94h) · 183 sun hours · 66% humidity · Moderate crowd · UV 2 (low) · sunniest 1 in 10 days reach 3 (moderate)
December
8/1010–16°C (feels 14°C) · 7 rain days (73h) · 179 sun hours · 70% humidity · Quiet crowd · UV 2 (low)
Frequently asked questions about visiting Cagliari
When is the best time to visit Cagliari?
June is the highest-scoring month (10/10 on the Holiday Climate Index). Typical conditions: 20–28°C (3 rainy days). The top three months by score are June, October, May.
What is the worst time to visit Cagliari?
July is the lowest-scoring month (7/10, capped by extreme heat). Typical conditions: 23–32°C (0 rainy days).
Is Cagliari too hot in summer?
2 months (July, August) trip the heat deal-breaker in our scoring: apparent temperature crosses the comfort cap, so even with clear skies and low rain the score is held down. Plan around it if heat tolerance is low.
When are crowds lowest in Cagliari?
Search-interest seasonality (Google Trends 2021-2025) is lowest in January and peaks in August. Interest tracks both in-trip visitors and lead-time planners, so treat it as a "destination is on people's minds" signal rather than literal arrivals.
Which months in Cagliari have good weather but fewer tourists?
June (climate 10/10, crowd index 25) and February (climate 9/10, crowd index 3) — shoulder months with above-average climate and below-median search-interest. Often the best value-for-weather trade.
What is the UV index in Cagliari by month?
UV peaks at 9 (very high) in July and is lowest in December at 2 (low). Monthly peak values: Jan 2, Feb 3, Mar 4, Apr 6, May 7, Jun 8, Jul 9, Aug 8, Sep 6, Oct 4, Nov 2, Dec 2. June, July reach very high or extreme levels — apply SPF 50+, wear a hat and protective clothing, and limit direct sun between 11:00 and 17:00.
What is the UV index in Cagliari in July?
July is the peak UV month in Cagliari, with a daily-peak UV index of 9 (very high). At this level, sunburn can occur in under 20 minutes on unprotected fair skin. Apply SPF 50+, wear protective clothing and a hat, and avoid direct midday sun (11:00–17:00).
How high can UV get in Cagliari on the sunniest days?
Most days look like the monthly average, but on the sunniest ~1 in 10 days UV climbs higher than the mean suggests. August is the worst case: typical days average UV 8 (high), but the top 10% of days reach UV 9 (very high) — and even higher. Months where the sunniest days routinely exceed the typical reading: February, April, August, September, November. Plan sun protection for the worst case, not the average.
Is air quality in Cagliari bad for travelers?
PM2.5 (fine-particle pollution) exceeds the WHO sensitive-group guideline (15 µg/m³) in 1 month: July. The worst month is July with a typical-day mean of 9 µg/m³ (fair); on the worst 10% of days PM2.5 reaches 15 µg/m³ (unhealthy for sensitive) and higher. People with asthma, heart conditions, or sensitive children may want to avoid these months or limit outdoor activity. Source: CAMS via Open-Meteo.