Best time to visit Bocas del Toro
Re-score for me — drag the dial — every chart recolours live for your heat & sea limits 27°C · sea 29°C
Default 27 °C is the upper edge of the Holiday Climate Index "ideal comfort" band (Scott, Rutty, Amelung & Tang, 2016). Above this, most warm-tourism travellers report measurable discomfort.
Default 29 °C is the Beach Climate Index "bathtub" line (Morgan et al.) — where the sea stops being refreshing and starts feeling like a warm bath.
Greyed factors are scored normally — extreme heat overrides them, so a clear sky or low rain can't lift the period.
Greyed factors are scored normally — extreme heat overrides them, so a clear sky or low rain can't lift the period.
Greyed factors are scored normally — extreme heat overrides them, so a clear sky or low rain can't lift the period.
Greyed factors are scored normally — extreme heat overrides them, so a clear sky or low rain can't lift the period.
Greyed factors are scored normally — extreme heat overrides them, so a clear sky or low rain can't lift the period.
Greyed factors are scored normally — extreme heat overrides them, so a clear sky or low rain can't lift the period.
Greyed factors are scored normally — extreme heat overrides them, so a clear sky or low rain can't lift the period.
Greyed factors are scored normally — extreme heat overrides them, so a clear sky or low rain can't lift the period.
Greyed factors are scored normally — extreme heat overrides them, so a clear sky or low rain can't lift the period.
Greyed factors are scored normally — extreme heat overrides them, so a clear sky or low rain can't lift the period.
Greyed factors are scored normally — extreme heat overrides them, so a clear sky or low rain can't lift the period.
Greyed factors are scored normally — extreme heat overrides them, so a clear sky or low rain can't lift the period.
Greyed factors are scored normally — extreme heat overrides them, so a clear sky or low rain can't lift the period.
Greyed factors are scored normally — extreme heat overrides them, so a clear sky or low rain can't lift the period.
Greyed factors are scored normally — extreme heat overrides them, so a clear sky or low rain can't lift the period.
Greyed factors are scored normally — extreme heat overrides them, so a clear sky or low rain can't lift the period.
Greyed factors are scored normally — extreme heat overrides them, so a clear sky or low rain can't lift the period.
Greyed factors are scored normally — extreme heat overrides them, so a clear sky or low rain can't lift the period.
Greyed factors are scored normally — extreme heat overrides them, so a clear sky or low rain can't lift the period.
Greyed factors are scored normally — extreme heat overrides them, so a clear sky or low rain can't lift the period.
Greyed factors are scored normally — extreme heat overrides them, so a clear sky or low rain can't lift the period.
Greyed factors are scored normally — extreme heat overrides them, so a clear sky or low rain can't lift the period.
Greyed factors are scored normally — extreme heat overrides them, so a clear sky or low rain can't lift the period.
Greyed factors are scored normally — extreme heat overrides them, so a clear sky or low rain can't lift the period.
Greyed factors are scored normally — extreme heat overrides them, so a clear sky or low rain can't lift the period.
Greyed factors are scored normally — extreme heat overrides them, so a clear sky or low rain can't lift the period.
Greyed factors are scored normally — extreme heat overrides them, so a clear sky or low rain can't lift the period.
Greyed factors are scored normally — extreme heat overrides them, so a clear sky or low rain can't lift the period.
Greyed factors are scored normally — extreme heat overrides them, so a clear sky or low rain can't lift the period.
Greyed factors are scored normally — extreme heat overrides them, so a clear sky or low rain can't lift the period.
Greyed factors are scored normally — extreme heat overrides them, so a clear sky or low rain can't lift the period.
Greyed factors are scored normally — extreme heat overrides them, so a clear sky or low rain can't lift the period.
Greyed factors are scored normally — extreme heat overrides them, so a clear sky or low rain can't lift the period.
Greyed factors are scored normally — extreme heat overrides them, so a clear sky or low rain can't lift the period.
Greyed factors are scored normally — extreme heat overrides them, so a clear sky or low rain can't lift the period.
Greyed factors are scored normally — extreme heat overrides them, so a clear sky or low rain can't lift the period.
Greyed factors are scored normally — extreme heat overrides them, so a clear sky or low rain can't lift the period.
Greyed factors are scored normally — extreme heat overrides them, so a clear sky or low rain can't lift the period.
Greyed factors are scored normally — extreme heat overrides them, so a clear sky or low rain can't lift the period.
Greyed factors are scored normally — extreme heat overrides them, so a clear sky or low rain can't lift the period.
Greyed factors are scored normally — extreme heat overrides them, so a clear sky or low rain can't lift the period.
Greyed factors are scored normally — extreme heat overrides them, so a clear sky or low rain can't lift the period.
Greyed factors are scored normally — extreme heat overrides them, so a clear sky or low rain can't lift the period.
Greyed factors are scored normally — extreme heat overrides them, so a clear sky or low rain can't lift the period.
Greyed factors are scored normally — extreme heat overrides them, so a clear sky or low rain can't lift the period.
Greyed factors are scored normally — extreme heat overrides them, so a clear sky or low rain can't lift the period.
Greyed factors are scored normally — extreme heat overrides them, so a clear sky or low rain can't lift the period.
Greyed factors are scored normally — extreme heat overrides them, so a clear sky or low rain can't lift the period.
Greyed factors are scored normally — extreme heat overrides them, so a clear sky or low rain can't lift the period.
Greyed factors are scored normally — extreme heat overrides them, so a clear sky or low rain can't lift the period.
Greyed factors are scored normally — extreme heat overrides them, so a clear sky or low rain can't lift the period.
Greyed factors are scored normally — extreme heat overrides them, so a clear sky or low rain can't lift the period.
Greyed factors are scored normally — extreme heat overrides them, so a clear sky or low rain can't lift the period.
Greyed factors are scored normally — extreme heat overrides them, so a clear sky or low rain can't lift the period.
Greyed factors are scored normally — extreme heat overrides them, so a clear sky or low rain can't lift the period.
Greyed factors are scored normally — extreme heat overrides them, so a clear sky or low rain can't lift the period.
Greyed factors are scored normally — extreme heat overrides them, so a clear sky or low rain can't lift the period.
Greyed factors are scored normally — extreme heat overrides them, so a clear sky or low rain can't lift the period.
Greyed factors are scored normally — extreme heat overrides them, so a clear sky or low rain can't lift the period.
Greyed factors are scored normally — extreme heat overrides them, so a clear sky or low rain can't lift the period.
Greyed factors are scored normally — extreme heat overrides them, so a clear sky or low rain can't lift the period.
Greyed factors are scored normally — extreme heat overrides them, so a clear sky or low rain can't lift the period.
Greyed factors are scored normally — extreme heat overrides them, so a clear sky or low rain can't lift the period.
Greyed factors are scored normally — extreme heat overrides them, so a clear sky or low rain can't lift the period.
Greyed factors are scored normally — extreme heat overrides them, so a clear sky or low rain can't lift the period.
Greyed factors are scored normally — extreme heat overrides them, so a clear sky or low rain can't lift the period.
Greyed factors are scored normally — extreme heat overrides them, so a clear sky or low rain can't lift the period.
Greyed factors are scored normally — extreme heat overrides them, so a clear sky or low rain can't lift the period.
Greyed factors are scored normally — extreme heat overrides them, so a clear sky or low rain can't lift the period.
Greyed factors are scored normally — extreme heat overrides them, so a clear sky or low rain can't lift the period.
Greyed factors are scored normally — extreme heat overrides them, so a clear sky or low rain can't lift the period.
Greyed factors are scored normally — extreme heat overrides them, so a clear sky or low rain can't lift the period.
Greyed factors are scored normally — extreme heat overrides them, so a clear sky or low rain can't lift the period.
Greyed factors are scored normally — extreme heat overrides them, so a clear sky or low rain can't lift the period.
Greyed factors are scored normally — extreme heat overrides them, so a clear sky or low rain can't lift the period.
Greyed factors are scored normally — extreme heat overrides them, so a clear sky or low rain can't lift the period.
Greyed factors are scored normally — extreme heat overrides them, so a clear sky or low rain can't lift the period.
Greyed factors are scored normally — extreme heat overrides them, so a clear sky or low rain can't lift the period.
Greyed factors are scored normally — extreme heat overrides them, so a clear sky or low rain can't lift the period.
Greyed factors are scored normally — extreme heat overrides them, so a clear sky or low rain can't lift the period.
Greyed factors are scored normally — extreme heat overrides them, so a clear sky or low rain can't lift the period.
Greyed factors are scored normally — extreme heat overrides them, so a clear sky or low rain can't lift the period.
Greyed factors are scored normally — extreme heat overrides them, so a clear sky or low rain can't lift the period.
Greyed factors are scored normally — extreme heat overrides them, so a clear sky or low rain can't lift the period.
Greyed factors are scored normally — extreme heat overrides them, so a clear sky or low rain can't lift the period.
Greyed factors are scored normally — extreme heat overrides them, so a clear sky or low rain can't lift the period.
Greyed factors are scored normally — extreme heat overrides them, so a clear sky or low rain can't lift the period.
Greyed factors are scored normally — extreme heat overrides them, so a clear sky or low rain can't lift the period.
Greyed factors are scored normally — extreme heat overrides them, so a clear sky or low rain can't lift the period.
Greyed factors are scored normally — extreme heat overrides them, so a clear sky or low rain can't lift the period.
Greyed factors are scored normally — extreme heat overrides them, so a clear sky or low rain can't lift the period.
Greyed factors are scored normally — extreme heat overrides them, so a clear sky or low rain can't lift the period.
How is this scored? HCI / Steadman / CCI gate — full methodology and citations below.
Compare with another destination
Add as many as you like — stacked below the main strips above. Each row is just the recent-window score strip and (for beach destinations) sea-temperature strip.
Tours in Bocas del Toro
6 top-rated tours via Viator. Booking links earn this site a commission at no cost to you. Map locations are approximate (centred on Bocas del Toro).
- 1
 A Bocas Mangrove Kayak & Reef Snorkel Eco Tour
 - 2
 Bocas del Toro Island Hopping Day Tour in Zapatilla Beach
 - 3
 Bioluminescence Snorkeling and Boat Experience at Bocas del Toro
 - 4
 Bocas del Toro Boat Tour Zapatilla Snorkeling and Island Hopping
 - 5
 Bocas Del Toro Dolphin Bay, Chocolate Farm and Snorkel Tour
 - 6
 Yoga Sound Healing and Ecstatic Dance in Bocas del Toro town
Last refreshed 2026-06-28.
Similar climatesPuerto Viejo88% · Bali78% · Punta Cana72%
Other destinations with the most-alike year-round climate to Bocas del Toro (apparent temperature, rain hours, sunshine — matched within the same trip-profile). The ±N chip compares each match's typical score for the current month against Bocas del Toro's. Based on the 2020-2024 climatology, not this year's actual weather.
Month-by-month
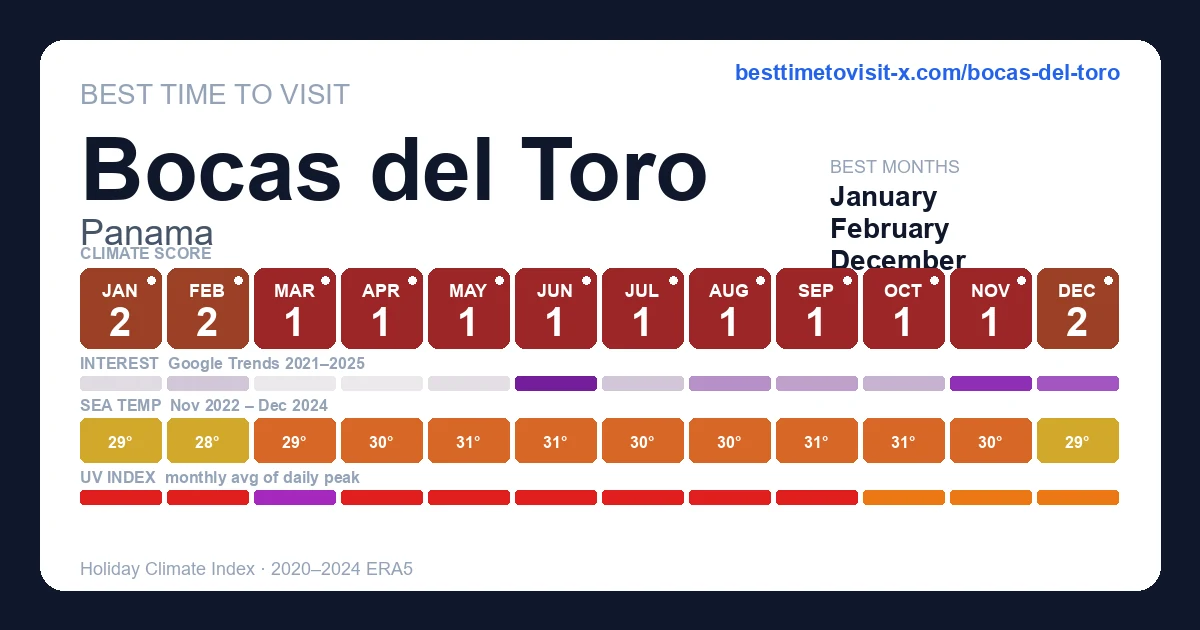
| Month | Temp °C | Feels °C | Rain days | Rain h | Rain h/day | Humidity | Wind km/h | Sun h | UV | Interest | Score |
|---|---|---|---|---|---|---|---|---|---|---|---|
| Jan | 24–27 | 30 | 26 | 355 | 13.7 | 79% | 17 | 238 | 9 | Busy | 2 |
| Feb | 24–27 | 30 | 22 | 306 | 13.9 | 77% | 17 | 221 | 10 | Moderate | 2 |
| Mar | 24–28 | 31 | 26 | 334 | 12.8 | 74% | 15 | 250 | 12 | Moderate | 1 |
| Apr | 25–28 | 32 | 25 | 351 | 14.0 | 77% | 15 | 222 | 11 | Quiet | 1 |
| May | 25–29 | 33 | 26 | 397 | 15.3 | 80% | 14 | 225 | 10 | Quiet | 1 |
| Jun | 25–28 | 33 | 29 | 415 | 14.3 | 83% | 14 | 205 | 8 | Quiet | 1 |
| Jul | 25–28 | 32 | 30 | 457 | 15.2 | 84% | 18 | 195 | 9 | Quiet | 1 |
| Aug | 25–28 | 33 | 28 | 400 | 14.3 | 83% | 16 | 209 | 10 | Busy | 1 |
| Sep | 25–29 | 34 | 28 | 345 | 12.3 | 83% | 13 | 213 | 9 | Quiet | 1 |
| Oct | 25–28 | 33 | 29 | 400 | 13.8 | 83% | 14 | 211 | 8 | Busy | 1 |
| Nov | 24–28 | 32 | 28 | 447 | 16.0 | 83% | 17 | 189 | 7 | Peak | 1 |
| Dec | 24–27 | 31 | 27 | 421 | 15.6 | 82% | 19 | 218 | 8 | Moderate | 2 |
UV Index in Bocas del Toro by Month
UV index in Bocas del Toro peaks at 12 (extreme) in March, dropping to 7 (high) in November. January, February, March, April, May, June, July, August, September reach very high or extreme levels — apply SPF 50+, wear a hat and protective clothing, and limit direct sun between 11:00 and 17:00.
Best months in detail
February
2/1024–27°C (feels 30°C) · 22 rain days (306h) · 221 sun hours · 77% humidity · Moderate crowd · UV 10 (very high) · sunniest 1 in 10 days reach 12 (extreme)
January
2/1024–27°C (feels 30°C) · 26 rain days (355h) · 238 sun hours · 79% humidity · Busy crowd · UV 9 (very high) · sunniest 1 in 10 days reach 11 (very high)
December
2/1024–27°C (feels 31°C) · 27 rain days (421h) · 218 sun hours · 82% humidity · Moderate crowd · UV 8 (high) · sunniest 1 in 10 days reach 10 (very high)
Every month
Show the other 9 months in detail
March
1/1024–28°C (feels 31°C) · 26 rain days (334h) · 250 sun hours · 74% humidity · Moderate crowd · UV 12 (extreme) · sunniest 1 in 10 days reach 13 (extreme)
April
1/1025–28°C (feels 32°C) · 25 rain days (351h) · 222 sun hours · 77% humidity · Quiet crowd · UV 11 (very high) · sunniest 1 in 10 days reach 13 (extreme)
May
1/1025–29°C (feels 33°C) · 26 rain days (397h) · 225 sun hours · 80% humidity · Quiet crowd · UV 10 (very high) · sunniest 1 in 10 days reach 12 (extreme)
June
1/1025–28°C (feels 33°C) · 29 rain days (415h) · 205 sun hours · 83% humidity · Quiet crowd · UV 8 (very high) · sunniest 1 in 10 days reach 11 (very high)
July
1/1025–28°C (feels 32°C) · 30 rain days (457h) · 195 sun hours · 84% humidity · Quiet crowd · UV 9 (very high) · sunniest 1 in 10 days reach 11 (extreme)
August
1/1025–28°C (feels 33°C) · 28 rain days (400h) · 209 sun hours · 83% humidity · Busy crowd · UV 10 (very high) · sunniest 1 in 10 days reach 12 (extreme)
September
1/1025–29°C (feels 34°C) · 28 rain days (345h) · 213 sun hours · 83% humidity · Quiet crowd · UV 9 (very high) · sunniest 1 in 10 days reach 11 (extreme)
October
1/1025–28°C (feels 33°C) · 29 rain days (400h) · 211 sun hours · 83% humidity · Busy crowd · UV 8 (high) · sunniest 1 in 10 days reach 10 (very high)
November
1/1024–28°C (feels 32°C) · 28 rain days (447h) · 189 sun hours · 83% humidity · Peak crowd · UV 7 (high) · sunniest 1 in 10 days reach 10 (very high)
In Bocas the port closes the park, and the fee is not refunded
November is the wettest month in the archipelago — 357mm over 26 rain days on the 1991-2020 average — and it is also when interest in Bocas peaks. September is its mirror image: 190mm, the least of any month in the wet half, and the calmest month for wind at a 9.6 km/h mean against 13-14 km/h from November to January. In an archipelago where wind decides whether boats sail, that ordering matters more than rainfall.
Nothing here is reached by road. Isla Colon has an airstrip; everything else is a water taxi, which makes the operative authority the Autoridad Maritima de Panama, not the forecast. When the AMP prohibits departures in bad weather the Ministerio de Ambiente closes the Parque Nacional Marino Isla Bastimentos with it, on IMHPA forecasts and SINAPROC alerts. It reopens on the AMP, not on the sunshine: the 3 November 2025 notice reopened the park because departure clearances had resumed.
The money side catches people out. Entry to Isla Bastimentos by sea is B/.10 for foreign visitors and B/.4 for nationals, obligatory by law, and MiAmbiente states that where an already-paid visit is cancelled for reasons outside its control there is no refund. It runs under resolution DM-022 of 1988 and resolution 0013 of 2024 on public use. Cayo Zapatilla 2 is open under posted rules; Cayo Zapatilla 1 has been restricted since 2018 as a hawksbill nesting site of global importance.
Sources: MiAmbiente — Medidas legales de conservacion del Parque Nacional Isla Bastimentos (fees, no refunds, Cayo Zapatilla rules) , MiAmbiente — Se reanudan las visitas al Parque Nacional Marino Isla Bastimentos (3 November 2025, reopening tied to AMP zarpes) , MiAmbiente — Cierre de las areas protegidas marinas e insulares por mal tiempo (IMHPA / SINAPROC / AMP) , MiAmbiente — Resolucion DM-0496-2025: single-use plastic and polystyrene banned in protected areas from 1 January 2026 , MiAmbiente — Boyas de amarre en Cayo Zapatilla 2 (resoluciones DM-022 de 1988 y 0013 de 2024)
What is the best time of year to visit Bocas del Toro?
February and March are the outright driest, at 124mm and 122mm. Within the wet half, September stands out: 190mm, less than any other month from May to December, and the calmest winds of the year at a 9.6 km/h mean, which is what governs whether boats run in an archipelago with no roads between islands.
Why is November the busiest month if it is also the wettest?
Interest peaks in November despite 357mm falling over 26 rain days, the year's highest. Panama's national holidays cluster in that month, and domestic travel follows them rather than the rainfall. Wind is also back up to a 13 km/h mean by November, from 9.6 in September, so boat days are less reliable at the same time.
How do you get to Bocas del Toro?
By air to the airstrip on Isla Colon, or by boat from Almirante on the mainland, where water taxis and a vehicle ferry cross to Bocas Town. There is no road link to the islands and no bridge, so every arrival and every day trip depends on a boat being cleared to sail.
What does it cost to enter Isla Bastimentos national marine park?
MiAmbiente charges B/.10 for foreign visitors and B/.4 for nationals arriving by sea. The ministry states the charge is obligatory by law and that its staff are obliged to collect it, so a tour price that omits it is incomplete. Panama uses the balboa at parity with the US dollar, so B/.10 is USD 10.
What happens to my money if the trip is cancelled by weather?
You do not get it back. MiAmbiente's own statement on the park is that when already-paid visits are cancelled for reasons outside the ministry's control, no refunds are made, though it undertook to discuss the point with boat operators. Paying at the park gate rather than prepaying limits the exposure.
Can you visit the Cayos Zapatillas?
Cayo Zapatilla 2 is open to nationals and foreigners alike, subject to conditions: land at the jetty to avoid eroding the beach, no alcohol, no loud music, take all rubbish away with you. Cayo Zapatilla 1 has been restricted since 2018 because it is a globally important hawksbill turtle nesting site.
Are single-use plastics allowed in Panama's national parks?
No. Resolution DM-0496-2025, published in Gaceta Oficial 30398-C, bans bringing in, using, selling or distributing single-use plastic and polystyrene products inside every protected area in the national system from 1 January 2026, under a zero-waste rule MiAmbiente phrases as: what you bring in, you take back out.
When do turtles nest in the Bocas archipelago?
Hawksbills nest through the middle of the year on Cayo Zapatilla, where rangers had logged 89 nests by early June 2025 during night patrols. MiAmbiente asks visitors not to shine artificial light from boats, to respect the marked access limits, and not to land on or walk the nesting beaches after dark.
How busy does Isla Bastimentos get?
It was the single most visited protected area in Panama over Semana Santa 2026, ahead of Cerro Ancon in Panama City and Isla Iguana. MiAmbiente deployed 750 staff across 54 protected areas for that operative, and set marine-park hours at 7:00 to 15:00, an hour shorter than the 7:00 to 16:00 applied to land parks.
Does Bocas del Toro have a real dry season?
Not in the way Panama's Pacific side does. Every month here averages at least 120mm and 17 rain days, and the annual spread runs only from 122mm in March to 357mm in November. Planning is therefore about wind and sea state rather than about finding a dry month, because there is not one.
Frequently asked questions about visiting Bocas del Toro
When is the best time to visit Bocas del Toro?
February is the highest-scoring month (2/10 on the Holiday Climate Index). Typical conditions: 24–27°C (22 rainy days). The top three months by score are February, January, December.
What is the worst time to visit Bocas del Toro?
September is the lowest-scoring month (1/10, capped by extreme heat). Typical conditions: 25–29°C (28 rainy days).
Is Bocas del Toro too hot in summer?
12 months (January, February, March, April, May, June, July, August, September, October, November, December) trip the heat deal-breaker in our scoring: apparent temperature crosses the comfort cap, so even with clear skies and low rain the score is held down. Plan around it if heat tolerance is low.
When are crowds lowest in Bocas del Toro?
Search-interest seasonality (Google Trends 2021-2025) is lowest in June and peaks in November. Interest tracks both in-trip visitors and lead-time planners, so treat it as a "destination is on people's minds" signal rather than literal arrivals.
What is the UV index in Bocas del Toro by month?
UV peaks at 12 (extreme) in March and is lowest in November at 7 (high). Monthly peak values: Jan 9, Feb 10, Mar 12, Apr 11, May 10, Jun 8, Jul 9, Aug 10, Sep 9, Oct 8, Nov 7, Dec 8. January, February, March, April, May, June, July, August, September reach very high or extreme levels — apply SPF 50+, wear a hat and protective clothing, and limit direct sun between 11:00 and 17:00.
What is the UV index in Bocas del Toro in March?
March is the peak UV month in Bocas del Toro, with a daily-peak UV index of 12 (extreme). At this level, sunburn can occur in under 20 minutes on unprotected fair skin. Apply SPF 50+, wear protective clothing and a hat, and avoid direct midday sun (11:00–17:00).
How high can UV get in Bocas del Toro on the sunniest days?
Most days look like the monthly average, but on the sunniest ~1 in 10 days UV climbs higher than the mean suggests. March is the worst case: typical days average UV 12 (extreme), but the top 10% of days reach UV 13 (extreme) — and even higher. Months where the sunniest days routinely exceed the typical reading: January, February, March, April, May, June, July, August, September, October, November, December. Plan sun protection for the worst case, not the average.