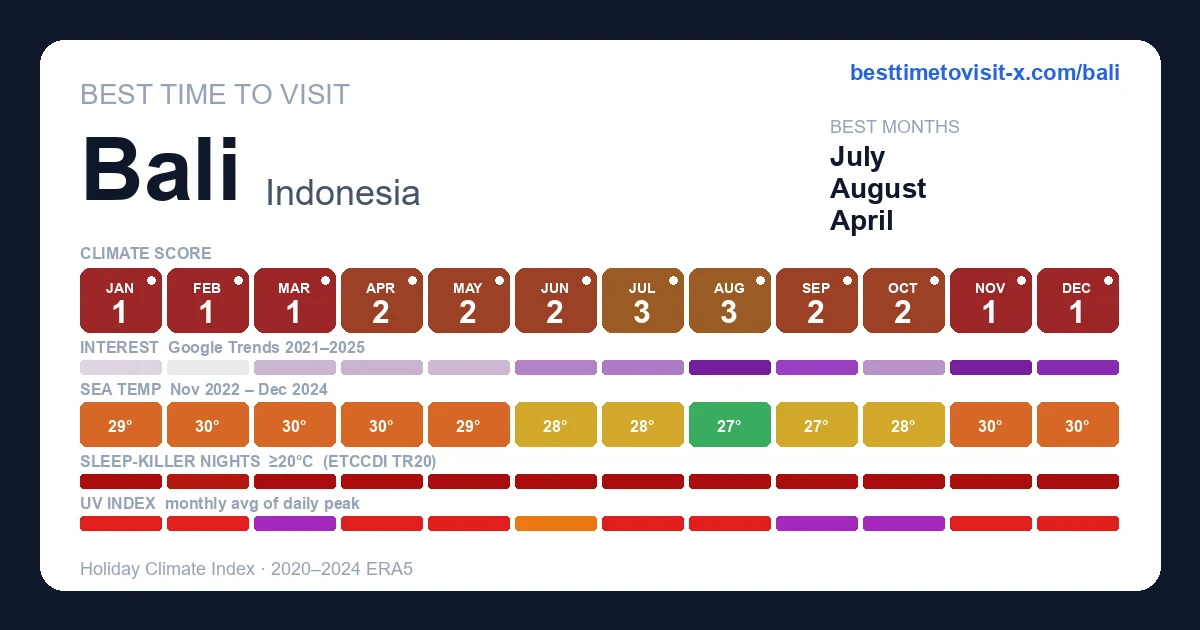
Best time to visit Bali
Re-score for me — drag the dial — every chart recolours live for your heat & sea limits 27°C · sea 29°C
Default 27 °C is the upper edge of the Holiday Climate Index "ideal comfort" band (Scott, Rutty, Amelung & Tang, 2016). Above this, most warm-tourism travellers report measurable discomfort.
Default 29 °C is the Beach Climate Index "bathtub" line (Morgan et al.) — where the sea stops being refreshing and starts feeling like a warm bath.
Greyed factors are scored normally — extreme heat overrides them, so a clear sky or low rain can't lift the period.
Greyed factors are scored normally — extreme heat overrides them, so a clear sky or low rain can't lift the period.
Greyed factors are scored normally — extreme heat overrides them, so a clear sky or low rain can't lift the period.
Greyed factors are scored normally — extreme heat overrides them, so a clear sky or low rain can't lift the period.
Greyed factors are scored normally — extreme heat overrides them, so a clear sky or low rain can't lift the period.
Greyed factors are scored normally — extreme heat overrides them, so a clear sky or low rain can't lift the period.
Greyed factors are scored normally — extreme heat overrides them, so a clear sky or low rain can't lift the period.
Greyed factors are scored normally — extreme heat overrides them, so a clear sky or low rain can't lift the period.
Greyed factors are scored normally — extreme heat overrides them, so a clear sky or low rain can't lift the period.
Greyed factors are scored normally — extreme heat overrides them, so a clear sky or low rain can't lift the period.
Greyed factors are scored normally — extreme heat overrides them, so a clear sky or low rain can't lift the period.
Greyed factors are scored normally — extreme heat overrides them, so a clear sky or low rain can't lift the period.
Greyed factors are scored normally — extreme heat overrides them, so a clear sky or low rain can't lift the period.
Greyed factors are scored normally — extreme heat overrides them, so a clear sky or low rain can't lift the period.
Greyed factors are scored normally — extreme heat overrides them, so a clear sky or low rain can't lift the period.
Greyed factors are scored normally — extreme heat overrides them, so a clear sky or low rain can't lift the period.
Greyed factors are scored normally — extreme heat overrides them, so a clear sky or low rain can't lift the period.
Greyed factors are scored normally — extreme heat overrides them, so a clear sky or low rain can't lift the period.
Greyed factors are scored normally — extreme heat overrides them, so a clear sky or low rain can't lift the period.
Greyed factors are scored normally — extreme heat overrides them, so a clear sky or low rain can't lift the period.
Greyed factors are scored normally — extreme heat overrides them, so a clear sky or low rain can't lift the period.
Greyed factors are scored normally — extreme heat overrides them, so a clear sky or low rain can't lift the period.
Greyed factors are scored normally — extreme heat overrides them, so a clear sky or low rain can't lift the period.
Greyed factors are scored normally — extreme heat overrides them, so a clear sky or low rain can't lift the period.
Greyed factors are scored normally — extreme heat overrides them, so a clear sky or low rain can't lift the period.
Greyed factors are scored normally — extreme heat overrides them, so a clear sky or low rain can't lift the period.
Greyed factors are scored normally — extreme heat overrides them, so a clear sky or low rain can't lift the period.
Greyed factors are scored normally — extreme heat overrides them, so a clear sky or low rain can't lift the period.
Greyed factors are scored normally — extreme heat overrides them, so a clear sky or low rain can't lift the period.
Greyed factors are scored normally — extreme heat overrides them, so a clear sky or low rain can't lift the period.
Greyed factors are scored normally — extreme heat overrides them, so a clear sky or low rain can't lift the period.
Greyed factors are scored normally — extreme heat overrides them, so a clear sky or low rain can't lift the period.
Greyed factors are scored normally — extreme heat overrides them, so a clear sky or low rain can't lift the period.
Greyed factors are scored normally — extreme heat overrides them, so a clear sky or low rain can't lift the period.
Greyed factors are scored normally — extreme heat overrides them, so a clear sky or low rain can't lift the period.
Greyed factors are scored normally — extreme heat overrides them, so a clear sky or low rain can't lift the period.
Greyed factors are scored normally — extreme heat overrides them, so a clear sky or low rain can't lift the period.
Greyed factors are scored normally — extreme heat overrides them, so a clear sky or low rain can't lift the period.
Greyed factors are scored normally — extreme heat overrides them, so a clear sky or low rain can't lift the period.
Greyed factors are scored normally — extreme heat overrides them, so a clear sky or low rain can't lift the period.
Greyed factors are scored normally — extreme heat overrides them, so a clear sky or low rain can't lift the period.
Greyed factors are scored normally — extreme heat overrides them, so a clear sky or low rain can't lift the period.
Greyed factors are scored normally — extreme heat overrides them, so a clear sky or low rain can't lift the period.
Greyed factors are scored normally — extreme heat overrides them, so a clear sky or low rain can't lift the period.
Greyed factors are scored normally — extreme heat overrides them, so a clear sky or low rain can't lift the period.
Greyed factors are scored normally — extreme heat overrides them, so a clear sky or low rain can't lift the period.
Greyed factors are scored normally — extreme heat overrides them, so a clear sky or low rain can't lift the period.
Greyed factors are scored normally — extreme heat overrides them, so a clear sky or low rain can't lift the period.
Greyed factors are scored normally — extreme heat overrides them, so a clear sky or low rain can't lift the period.
Greyed factors are scored normally — extreme heat overrides them, so a clear sky or low rain can't lift the period.
Greyed factors are scored normally — extreme heat overrides them, so a clear sky or low rain can't lift the period.
Greyed factors are scored normally — extreme heat overrides them, so a clear sky or low rain can't lift the period.
Greyed factors are scored normally — extreme heat overrides them, so a clear sky or low rain can't lift the period.
Greyed factors are scored normally — extreme heat overrides them, so a clear sky or low rain can't lift the period.
Greyed factors are scored normally — extreme heat overrides them, so a clear sky or low rain can't lift the period.
Greyed factors are scored normally — extreme heat overrides them, so a clear sky or low rain can't lift the period.
Greyed factors are scored normally — extreme heat overrides them, so a clear sky or low rain can't lift the period.
Greyed factors are scored normally — extreme heat overrides them, so a clear sky or low rain can't lift the period.
Greyed factors are scored normally — extreme heat overrides them, so a clear sky or low rain can't lift the period.
Greyed factors are scored normally — extreme heat overrides them, so a clear sky or low rain can't lift the period.
Greyed factors are scored normally — extreme heat overrides them, so a clear sky or low rain can't lift the period.
Greyed factors are scored normally — extreme heat overrides them, so a clear sky or low rain can't lift the period.
Greyed factors are scored normally — extreme heat overrides them, so a clear sky or low rain can't lift the period.
Greyed factors are scored normally — extreme heat overrides them, so a clear sky or low rain can't lift the period.
Greyed factors are scored normally — extreme heat overrides them, so a clear sky or low rain can't lift the period.
Greyed factors are scored normally — extreme heat overrides them, so a clear sky or low rain can't lift the period.
Greyed factors are scored normally — extreme heat overrides them, so a clear sky or low rain can't lift the period.
Greyed factors are scored normally — extreme heat overrides them, so a clear sky or low rain can't lift the period.
Greyed factors are scored normally — extreme heat overrides them, so a clear sky or low rain can't lift the period.
Greyed factors are scored normally — extreme heat overrides them, so a clear sky or low rain can't lift the period.
Greyed factors are scored normally — extreme heat overrides them, so a clear sky or low rain can't lift the period.
Greyed factors are scored normally — extreme heat overrides them, so a clear sky or low rain can't lift the period.
Greyed factors are scored normally — extreme heat overrides them, so a clear sky or low rain can't lift the period.
Greyed factors are scored normally — extreme heat overrides them, so a clear sky or low rain can't lift the period.
Greyed factors are scored normally — extreme heat overrides them, so a clear sky or low rain can't lift the period.
Greyed factors are scored normally — extreme heat overrides them, so a clear sky or low rain can't lift the period.
Greyed factors are scored normally — extreme heat overrides them, so a clear sky or low rain can't lift the period.
Greyed factors are scored normally — extreme heat overrides them, so a clear sky or low rain can't lift the period.
Greyed factors are scored normally — extreme heat overrides them, so a clear sky or low rain can't lift the period.
Greyed factors are scored normally — extreme heat overrides them, so a clear sky or low rain can't lift the period.
Greyed factors are scored normally — extreme heat overrides them, so a clear sky or low rain can't lift the period.
Greyed factors are scored normally — extreme heat overrides them, so a clear sky or low rain can't lift the period.
How is this scored? HCI / Steadman / CCI gate — full methodology and citations below.
Compare with another destination
Add as many as you like — stacked below the main strips above. Each row is just the recent-window score strip and (for beach destinations) sea-temperature strip.
Tours in Bali
30 top-rated tours via Viator. Booking links earn this site a commission at no cost to you. Map locations are approximate (centred on Bali).
- 1
 ️ Bali Instagram Tour: The Most Famous Spots (Private & All-Inclusive)
 - 2
 Bali to Nusa Penida: Premium Private Full Day Tour-All Inclusive
 - 3
 ️ Nusa Penida Instagram Tour: The Most Famous Spots (Private All-Inclusive)
 - 4
 Bali Secret Waterfall Tour - Private and All-Inclusive
 - 5
 Nusa Penida Premium Day from Bali: Manta Rays, Yacht & Land Tour
 - 6
 Discover The Best of Ubud: All-Inclusive and Private Guided Tour
 - 7
 Best of Ubud Full-Day Tour with Jungle Swing
 - 8
 Ubud Top Attractions: Waterfalls, Temples and Rice Terraces
 - 9
 Private 1-Day Ubud Highlights Tour
 - 10
 Full-Day Tour to Water Temples and UNESCO Rice Terraces in Bali
 - 11
 Best of Ubud Attractions: Private All-Inclusive Tour
 - 12
 Mount Batur Sunrise Trekking - Guided Hike with Breakfast on Top
 - 13
 Mount Batur Sunrise Hike and Natural Hot Spring Option
 - 14
 Bali Hai Sunset Dinner Cruise
 - 15
 Ubud Private Tour - All Inclusive Premium Experience
 - 16
 Private Uluwatu Sunset Tour with Kecak Dance and Dinner
 - 17
 Ubud ATV Quad Bike Adventure with Gorilla Cave and Lunch
 - 18
 Ubud: Monkey Forest, Jungle Swing, Rice Terrace and Water Temple
 - 19
 Experts Bali Driver : Best Bali Private Driver for Tour in Bali
 - 20
 East Bali Tour: Gate of Heaven, Water Palace, Sleeping Gajah
 - 21
 Best of Bali 3-Day Packaged Tour
 - 22
 Tanah Lot and North Bali Tour: Scenic Journey
 - 23
 Private Uluwatu Temple and Kecak Fire Dance Evening Tour in Jimbaran Bay
 - 24
 Mount Batur Sunrise Jeep Tour with Optional Activities
 - 25
 Bali Instagram: Gate of Heaven Temple Tour
 - 26
 Bali Blue Lagoon Snorkeling with Lunch & Hotel Transfer
 - 27
 Ubud White Water Rafting on the Ayung River with Pickup & Lunch
 - 28
 Bali Nusa Penida West Private All-Inclusive Tour
 - 29
 Mount Batur Sunrise Trekking
 - 30
 Ubud Tour with Monkey Forest Waterfalls Temples and More
Last refreshed 2026-05-25.
Similar climatesPort Douglas85% · Puerto Viejo83% · Punta Cana80%
Other destinations with the most-alike year-round climate to Bali (apparent temperature, rain hours, sunshine — matched within the same trip-profile). The ±N chip compares each match's typical score for the current month against Bali's. Based on the 2020-2024 climatology, not this year's actual weather.
Month-by-month
| Month | Temp °C | Feels °C | Rain days | Rain h | Rain h/day | Humidity | Wind km/h | Sun h | UV | Interest | Score |
|---|---|---|---|---|---|---|---|---|---|---|---|
| Jan | 24–29 | 34 | 26 | 390 | 15.0 | 76% | 17 | 218 | 10 | Quiet | 1 |
| Feb | 24–29 | 34 | 26 | 364 | 14.0 | 79% | 15 | 195 | 11 | Quiet | 1 |
| Mar | 24–30 | 35 | 26 | 315 | 12.1 | 78% | 13 | 235 | 12 | Quiet | 1 |
| Apr | 24–29 | 34 | 22 | 286 | 13.0 | 77% | 14 | 230 | 10 | Quiet | 2 |
| May | 24–29 | 33 | 19 | 279 | 14.7 | 74% | 17 | 252 | 9 | Quiet | 2 |
| Jun | 24–28 | 32 | 20 | 306 | 15.3 | 74% | 18 | 241 | 8 | Moderate | 2 |
| Jul | 23–27 | 30 | 18 | 273 | 15.2 | 74% | 21 | 251 | 8 | Moderate | 3 |
| Aug | 23–28 | 30 | 21 | 278 | 13.2 | 74% | 20 | 254 | 10 | Peak | 3 |
| Sep | 23–28 | 31 | 21 | 288 | 13.7 | 73% | 18 | 254 | 12 | Busy | 2 |
| Oct | 23–29 | 33 | 20 | 288 | 14.4 | 72% | 16 | 264 | 12 | Moderate | 2 |
| Nov | 24–30 | 35 | 25 | 323 | 12.9 | 76% | 13 | 235 | 10 | Peak | 1 |
| Dec | 24–29 | 34 | 27 | 396 | 14.7 | 77% | 15 | 218 | 10 | Peak | 1 |
UV Index in Bali by Month
UV index in Bali peaks at 12 (extreme) in October, dropping to 8 (high) in June. January, February, March, April, May, July, August, September, October, November, December reach very high or extreme levels — apply SPF 50+, wear a hat and protective clothing, and limit direct sun between 11:00 and 17:00.
Best months in detail
July
3/1023–27°C (feels 30°C) · 18 rain days (273h) · 251 sun hours · 74% humidity · Moderate crowd · UV 8 (very high)
August
3/1023–28°C (feels 30°C) · 21 rain days (278h) · 254 sun hours · 74% humidity · Peak crowd · UV 10 (very high) · sunniest 1 in 10 days reach 11 (extreme)
September
2/1023–28°C (feels 31°C) · 21 rain days (288h) · 254 sun hours · 73% humidity · Busy crowd · UV 12 (extreme)
Every month
Show the other 9 months in detail
January
1/1024–29°C (feels 34°C) · 26 rain days (390h) · 218 sun hours · 76% humidity · Quiet crowd · UV 10 (very high) · sunniest 1 in 10 days reach 12 (extreme)
February
1/1024–29°C (feels 34°C) · 26 rain days (364h) · 195 sun hours · 79% humidity · Quiet crowd · UV 11 (very high) · sunniest 1 in 10 days reach 13 (extreme)
March
1/1024–30°C (feels 35°C) · 26 rain days (315h) · 235 sun hours · 78% humidity · Quiet crowd · UV 12 (extreme) · sunniest 1 in 10 days reach 13 (extreme)
April
2/1024–29°C (feels 34°C) · 22 rain days (286h) · 230 sun hours · 77% humidity · Quiet crowd · UV 10 (very high) · sunniest 1 in 10 days reach 12 (extreme)
May
2/1024–29°C (feels 33°C) · 19 rain days (279h) · 252 sun hours · 74% humidity · Quiet crowd · UV 9 (very high) · sunniest 1 in 10 days reach 10 (very high)
June
2/1024–28°C (feels 32°C) · 20 rain days (306h) · 241 sun hours · 74% humidity · Moderate crowd · UV 8 (high) · sunniest 1 in 10 days reach 9 (very high)
October
2/1023–29°C (feels 33°C) · 20 rain days (288h) · 264 sun hours · 72% humidity · Moderate crowd · UV 12 (extreme)
November
1/1024–30°C (feels 35°C) · 25 rain days (323h) · 235 sun hours · 76% humidity · Peak crowd · UV 10 (very high) · sunniest 1 in 10 days reach 12 (extreme)
December
1/1024–29°C (feels 34°C) · 27 rain days (396h) · 218 sun hours · 77% humidity · Peak crowd · UV 10 (very high) · sunniest 1 in 10 days reach 13 (extreme)
Comparisons people search for
Pairs validated by Google Autocomplete demand — only pairs people actually compare.
Frequently asked questions about visiting Bali
When is the best time to visit Bali?
July is the highest-scoring month (3/10 on the Holiday Climate Index). Typical conditions: 23–27°C (18 rainy days). The top three months by score are July, August, September.
What is the worst time to visit Bali?
November is the lowest-scoring month (1/10, capped by extreme heat). Typical conditions: 24–30°C (25 rainy days).
Is Bali too hot in summer?
12 months (January, February, March, April, May, June, July, August, September, October, November, December) trip the heat deal-breaker in our scoring: apparent temperature crosses the comfort cap, so even with clear skies and low rain the score is held down. Plan around it if heat tolerance is low.
When are crowds lowest in Bali?
Search-interest seasonality (Google Trends 2021-2025) is lowest in February and peaks in August. Interest tracks both in-trip visitors and lead-time planners, so treat it as a "destination is on people's minds" signal rather than literal arrivals.
What is the UV index in Bali by month?
UV peaks at 12 (extreme) in October and is lowest in June at 8 (high). Monthly peak values: Jan 10, Feb 11, Mar 12, Apr 10, May 9, Jun 8, Jul 8, Aug 10, Sep 12, Oct 12, Nov 10, Dec 10. January, February, March, April, May, July, August, September, October, November, December reach very high or extreme levels — apply SPF 50+, wear a hat and protective clothing, and limit direct sun between 11:00 and 17:00.
What is the UV index in Bali in October?
October is the peak UV month in Bali, with a daily-peak UV index of 12 (extreme). At this level, sunburn can occur in under 20 minutes on unprotected fair skin. Apply SPF 50+, wear protective clothing and a hat, and avoid direct midday sun (11:00–17:00).
How high can UV get in Bali on the sunniest days?
Most days look like the monthly average, but on the sunniest ~1 in 10 days UV climbs higher than the mean suggests. March is the worst case: typical days average UV 12 (extreme), but the top 10% of days reach UV 13 (extreme) — and even higher. Months where the sunniest days routinely exceed the typical reading: January, February, March, April, May, June, August, November, December. Plan sun protection for the worst case, not the average.
Is air quality in Bali bad for travelers?
PM2.5 (fine-particle pollution) exceeds the WHO sensitive-group guideline (15 µg/m³) in 4 months: January, February, March, November. The worst month is November with a typical-day mean of 13 µg/m³ (moderate); on the worst 10% of days PM2.5 reaches 19 µg/m³ (unhealthy for sensitive) and higher. People with asthma, heart conditions, or sensitive children may want to avoid these months or limit outdoor activity. Source: CAMS via Open-Meteo.