Best time to visit Wengen
Re-score for me — drag the dial — every chart on the page recolours live for your heat limit 27°C
Default 27 °C is the upper edge of the Holiday Climate Index "ideal comfort" band (Scott, Rutty, Amelung & Tang, 2016). Above this, most warm-tourism travellers report measurable discomfort.
Greyed factors are scored normally — extreme heat overrides them, so a clear sky or low rain can't lift the period.
Greyed factors are scored normally — extreme heat overrides them, so a clear sky or low rain can't lift the period.
Greyed factors are scored normally — extreme heat overrides them, so a clear sky or low rain can't lift the period.
Greyed factors are scored normally — extreme heat overrides them, so a clear sky or low rain can't lift the period.
Greyed factors are scored normally — extreme heat overrides them, so a clear sky or low rain can't lift the period.
Greyed factors are scored normally — extreme heat overrides them, so a clear sky or low rain can't lift the period.
Greyed factors are scored normally — extreme heat overrides them, so a clear sky or low rain can't lift the period.
Greyed factors are scored normally — extreme heat overrides them, so a clear sky or low rain can't lift the period.
Greyed factors are scored normally — extreme heat overrides them, so a clear sky or low rain can't lift the period.
Greyed factors are scored normally — extreme heat overrides them, so a clear sky or low rain can't lift the period.
Greyed factors are scored normally — extreme heat overrides them, so a clear sky or low rain can't lift the period.
Greyed factors are scored normally — extreme heat overrides them, so a clear sky or low rain can't lift the period.
Greyed factors are scored normally — extreme heat overrides them, so a clear sky or low rain can't lift the period.
Greyed factors are scored normally — extreme heat overrides them, so a clear sky or low rain can't lift the period.
Greyed factors are scored normally — extreme heat overrides them, so a clear sky or low rain can't lift the period.
Greyed factors are scored normally — extreme heat overrides them, so a clear sky or low rain can't lift the period.
Greyed factors are scored normally — extreme heat overrides them, so a clear sky or low rain can't lift the period.
Greyed factors are scored normally — extreme heat overrides them, so a clear sky or low rain can't lift the period.
Greyed factors are scored normally — extreme heat overrides them, so a clear sky or low rain can't lift the period.
Greyed factors are scored normally — extreme heat overrides them, so a clear sky or low rain can't lift the period.
Greyed factors are scored normally — extreme heat overrides them, so a clear sky or low rain can't lift the period.
Greyed factors are scored normally — extreme heat overrides them, so a clear sky or low rain can't lift the period.
Greyed factors are scored normally — extreme heat overrides them, so a clear sky or low rain can't lift the period.
Greyed factors are scored normally — extreme heat overrides them, so a clear sky or low rain can't lift the period.
Greyed factors are scored normally — extreme heat overrides them, so a clear sky or low rain can't lift the period.
Greyed factors are scored normally — extreme heat overrides them, so a clear sky or low rain can't lift the period.
Greyed factors are scored normally — extreme heat overrides them, so a clear sky or low rain can't lift the period.
Greyed factors are scored normally — extreme heat overrides them, so a clear sky or low rain can't lift the period.
Greyed factors are scored normally — extreme heat overrides them, so a clear sky or low rain can't lift the period.
Greyed factors are scored normally — extreme heat overrides them, so a clear sky or low rain can't lift the period.
Greyed factors are scored normally — extreme heat overrides them, so a clear sky or low rain can't lift the period.
Greyed factors are scored normally — extreme heat overrides them, so a clear sky or low rain can't lift the period.
Greyed factors are scored normally — extreme heat overrides them, so a clear sky or low rain can't lift the period.
Greyed factors are scored normally — extreme heat overrides them, so a clear sky or low rain can't lift the period.
Greyed factors are scored normally — extreme heat overrides them, so a clear sky or low rain can't lift the period.
Greyed factors are scored normally — extreme heat overrides them, so a clear sky or low rain can't lift the period.
Greyed factors are scored normally — extreme heat overrides them, so a clear sky or low rain can't lift the period.
How is this scored? HCI / Steadman / CCI gate — full methodology and citations below.
Compare with another destination
Add as many as you like — stacked below the main strips above. Each row is just the recent-window score strip and (for beach destinations) sea-temperature strip.
Similar climatesGrindelwald95% · Gstaad94% · Davos94%
Other destinations with the most-alike year-round climate to Wengen (apparent temperature, rain hours, sunshine — matched within the same trip-profile). The ±N chip compares each match's typical score for the current month against Wengen's. Based on the 2020-2024 climatology, not this year's actual weather.
Month-by-month
| Month | Temp °C | Feels °C | Rain days | Rain h | Rain h/day | Humidity | Wind km/h | Sun h | UV | Interest | Score |
|---|---|---|---|---|---|---|---|---|---|---|---|
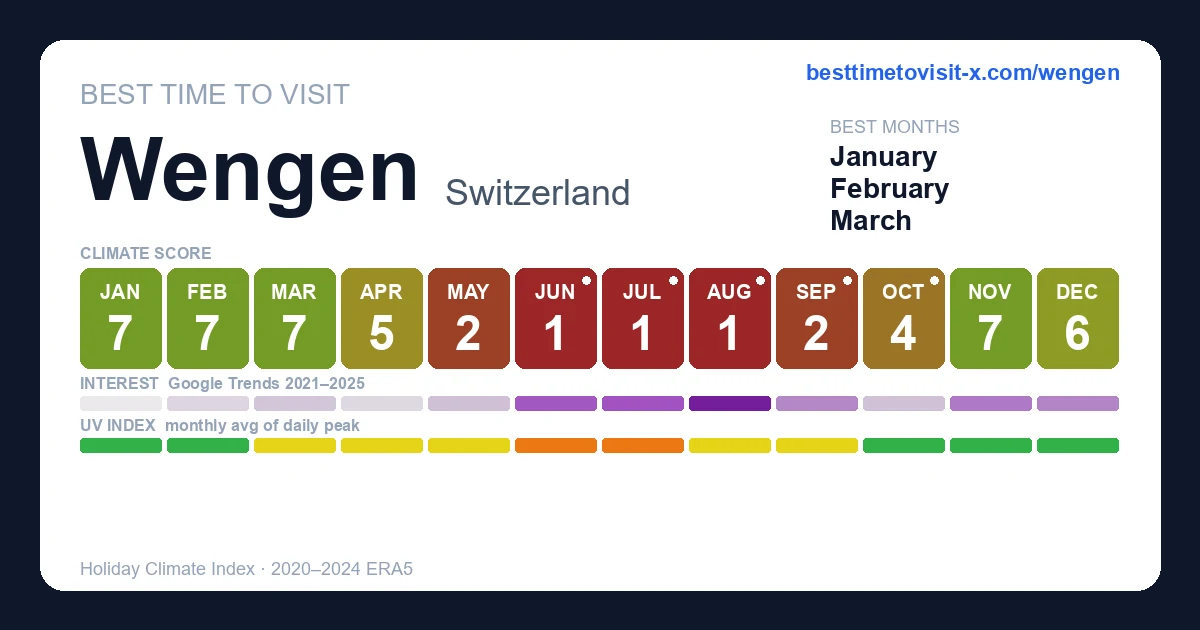
| Jan | -4–3 | 0 | 14 | 203 | 14.5 | 66% | 6 | 137 | 1 | Peak | 7 |
| Feb | -2–6 | 3 | 13 | 172 | 13.2 | 61% | 6 | 151 | 2 | Quiet | 7 |
| Mar | -2–7 | 4 | 15 | 193 | 12.9 | 63% | 6 | 193 | 3 | Quiet | 7 |
| Apr | 0–9 | 7 | 16 | 229 | 14.3 | 62% | 7 | 217 | 5 | Quiet | 5 |
| May | 5–13 | 12 | 23 | 313 | 13.6 | 70% | 7 | 228 | 5 | Quiet | 2 |
| Jun | 9–18 | 18 | 21 | 269 | 12.8 | 68% | 7 | 259 | 6 | Quiet | 1 |
| Jul | 11–20 | 20 | 18 | 248 | 13.8 | 67% | 7 | 285 | 6 | Quiet | 1 |
| Aug | 12–20 | 20 | 15 | 212 | 14.1 | 65% | 7 | 255 | 6 | Quiet | 1 |
| Sep | 9–16 | 15 | 19 | 242 | 12.7 | 70% | 6 | 217 | 4 | Quiet | 2 |
| Oct | 5–13 | 12 | 15 | 191 | 12.7 | 68% | 6 | 178 | 3 | Quiet | 4 |
| Nov | 1–7 | 5 | 14 | 190 | 13.6 | 70% | 5 | 133 | 1 | Quiet | 7 |
| Dec | -2–4 | 1 | 16 | 236 | 14.8 | 69% | 5 | 111 | 1 | Quiet | 6 |
UV Index in Wengen by Month
UV index in Wengen peaks at 6 (high) in June, dropping to 1 (low) in December. June, July have high UV — SPF 30+ and sunglasses recommended.
Best months in detail
February
7/10-2–6°C (feels 3°C) · 13 rain days (172h) · 151 sun hours · 61% humidity · Quiet crowd · UV 2 (low)
March
7/10-2–7°C (feels 4°C) · 15 rain days (193h) · 193 sun hours · 63% humidity · Quiet crowd · UV 3 (moderate) · sunniest 1 in 10 days reach 5 (moderate)
January
7/10-4–3°C (feels 0°C) · 14 rain days (203h) · 137 sun hours · 66% humidity · Peak crowd · UV 1 (low)
Every month
Show the other 9 months in detail
April
5/100–9°C (feels 7°C) · 16 rain days (229h) · 217 sun hours · 62% humidity · Quiet crowd · UV 5 (moderate) · sunniest 1 in 10 days reach 7 (high)
May
2/105–13°C (feels 12°C) · 23 rain days (313h) · 228 sun hours · 70% humidity · Quiet crowd · UV 5 (moderate) · sunniest 1 in 10 days reach 7 (high)
June
1/109–18°C · 21 rain days (269h) · 259 sun hours · 68% humidity · Quiet crowd · UV 6 (high) · sunniest 1 in 10 days reach 9 (very high)
July
1/1011–20°C · 18 rain days (248h) · 285 sun hours · 67% humidity · Quiet crowd · UV 6 (high) · sunniest 1 in 10 days reach 8 (very high)
August
1/1012–20°C · 15 rain days (212h) · 255 sun hours · 65% humidity · Quiet crowd · UV 6 (moderate) · sunniest 1 in 10 days reach 8 (high)
September
2/109–16°C · 19 rain days (242h) · 217 sun hours · 70% humidity · Quiet crowd · UV 4 (moderate) · sunniest 1 in 10 days reach 6 (high)
October
4/105–13°C (feels 12°C) · 15 rain days (191h) · 178 sun hours · 68% humidity · Quiet crowd · UV 3 (low) · sunniest 1 in 10 days reach 4 (moderate)
November
7/101–7°C (feels 5°C) · 14 rain days (190h) · 133 sun hours · 70% humidity · Quiet crowd · UV 1 (low)
December
6/10-2–4°C (feels 1°C) · 16 rain days (236h) · 111 sun hours · 69% humidity · Quiet crowd · UV 1 (low)
The cars that are here came up by train
Wengen is usually described as car-free, which is true but misleading. There is no ban. There is simply no road: no public route connects the village to the network at all, and the only ground links from the valley are field and forest tracks that are neither winter-safe nor open to private traffic.
The handful of vehicles that do operate here — taxis, hotel vans, a few local service trucks — were carried up on the Wengernalpbahn. The village's access schedule is therefore a railway timetable: the Lauterbrunnen section runs year-round, roughly every half hour, about fourteen minutes uphill.
That timetable also explains the real seasonal variable. Around 1,116 people live here permanently, but the village holds well over ten thousand in the winter season — a roughly ninefold swing, and it peaks in mid-January when the Lauberhorn draws some 30,000 spectators.
Sources: Lauberhorn — official race site, course data , Jungfrau Railways — Jungfraujoch, Top of Europe
Is Wengen car-free?
Effectively yes, but not by ordinance — there is no road connecting the village to the network, so private cars simply cannot reach it. The few taxis, hotel vans and service vehicles operating in the village were transported up by train. You leave your own car in Lauterbrunnen and take the Wengernalpbahn.
How do you get to Wengen?
By the Wengernalpbahn cog railway from Lauterbrunnen, roughly every half hour year-round and about fourteen minutes uphill. The line opened in 1893 and at just over 19 km is the world's longest continuous rack-and-pinion railway. There is no driving alternative, so build the timetable into your arrival plan.
When is the Lauberhorn race?
Mid-January — the 97th edition is set for 15 to 17 January 2027. It is the longest downhill on the World Cup circuit at about 4.5 km, with a vertical drop of 1,028 m and recorded speeds up to 161.9 km/h. Around 30,000 spectators attend, in a village of roughly 1,100 residents.
What is the best month to visit Wengen?
July or August for hiking, when the high trails are clear and the railways run at full frequency, though July is also the wettest month. January to March for skiing, avoiding the Lauberhorn weekend unless that is the draw. May and November are the quiet shoulders when lifts wind down.
Is the Jungfraujoch worth it?
It is the highest railway station in Europe at 3,454 m, with the Sphinx terrace at 3,571 m, and it operates 365 days a year. Return fares start around CHF 129.60, so it is expensive. Seat reservation is mandatory in the May to October peak, and the discounted early-train ticket also runs only in that window.
How busy does Wengen get?
Very, relative to its size. The permanent population is about 1,116, but the village holds more than ten thousand people in the winter season and around five thousand in the summer holidays. That ninefold winter swing, concentrated on a car-free village reached only by rail, is the practical constraint on booking.
How many days do you need in Wengen?
Three to four. One for the Jungfraujoch excursion, which takes most of a day; one for the Mannlichen ridge walk or the Kleine Scheidegg trails; and one or two for Lauterbrunnen valley, Grindelwald or Murren. Skiers should plan longer, since the Jungfrau region ski area is large and spread out.
What is the wettest month in Wengen?
July, and it coincides with the hiking peak — Alpine summer rain is convective, building through the afternoon rather than falling all day, so early starts matter. Winter precipitation arrives as snow. January lows sit around -7C in the village and considerably colder at altitude.
Can you drive to Wengen with luggage?
No — everything comes up on the train, including your bags. Hotels generally arrange transfer from the station using their own electric vehicles, so tell them your arrival time. Pack with the walk from station to hotel in mind; the village is small but the streets are sloped and can be snowy.
Is Wengen better than Grindelwald or Murren?
Wengen is quieter than Grindelwald and larger than Murren, sitting on a sunny terrace above the Lauterbrunnen valley. Grindelwald has more road access, more nightlife and more hotel capacity. Murren is smaller and higher. All three share the Jungfrau ski area, so the choice is about atmosphere rather than terrain.
Frequently asked questions about visiting Wengen
When is the best time to visit Wengen?
February is the highest-scoring month (7/10 on the Holiday Climate Index). Typical conditions: -2–6°C (13 rainy days). The top three months by score are February, March, January.
What is the worst time to visit Wengen?
July is the lowest-scoring month (1/10, capped by extreme heat). Typical conditions: 11–20°C (18 rainy days).
Is Wengen too hot in summer?
5 months (June, July, August, September, October) trip the heat deal-breaker in our scoring: apparent temperature crosses the comfort cap, so even with clear skies and low rain the score is held down. Plan around it if heat tolerance is low.
When are crowds lowest in Wengen?
Search-interest seasonality (Google Trends 2021-2025) is lowest in April and peaks in January. Interest tracks both in-trip visitors and lead-time planners, so treat it as a "destination is on people's minds" signal rather than literal arrivals.
Which months in Wengen have good weather but fewer tourists?
February (climate 7/10, crowd index 13) and March (climate 7/10, crowd index 5) — shoulder months with above-average climate and below-median search-interest. Often the best value-for-weather trade.
What is the UV index in Wengen by month?
UV peaks at 6 (high) in June and is lowest in December at 1 (low). Monthly peak values: Jan 1, Feb 2, Mar 3, Apr 5, May 5, Jun 6, Jul 6, Aug 6, Sep 4, Oct 3, Nov 1, Dec 1.
What is the UV index in Wengen in June?
June is the peak UV month in Wengen, with a daily-peak UV index of 6 (high). Apply SPF 30+, wear sunglasses, and seek shade during midday hours.
How high can UV get in Wengen on the sunniest days?
Most days look like the monthly average, but on the sunniest ~1 in 10 days UV climbs higher than the mean suggests. June is the worst case: typical days average UV 6 (high), but the top 10% of days reach UV 9 (very high) — and even higher. Months where the sunniest days routinely exceed the typical reading: March, April, May, June, July, August, September, October. Plan sun protection for the worst case, not the average.