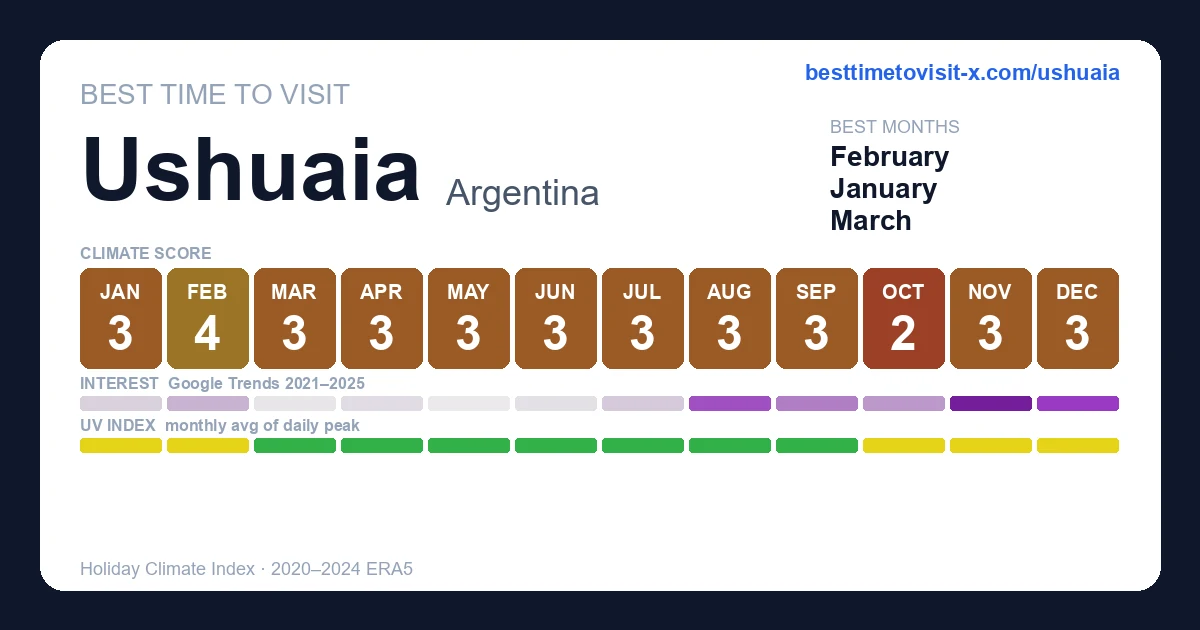
January 3/10
feels 10°C
(+1°C vs 2020-2024) · HCI 32/100
Day 12° · Night 5°
67% humidity 17 km/h wind 22 rain days (275h) 266h sun
Thermal 3
Sky 2
Rain 1
Wind 10
Higher = better, including rain & wind (green = "doesn't hurt the score", not "lots of it").
February 4/10
feels 10°C
· HCI 41/100
Day 12° · Night 5°
70% humidity 16 km/h wind 18 rain days (220h) 212h sun
Thermal 3
Sky 4
Rain 3
Wind 10
Higher = better, including rain & wind (green = "doesn't hurt the score", not "lots of it").
March 4/10
feels 8°C
(+1°C vs 2020-2024) · HCI 39/100
Day 10° · Night 4°
74% humidity 16 km/h wind 17 rain days (210h) 190h sun
Thermal 2
Sky 5
Rain 4
Wind 10
Higher = better, including rain & wind (green = "doesn't hurt the score", not "lots of it").
April 4/10
feels 4°C
· HCI 38/100
Day 7° · Night 2°
81% humidity 13 km/h wind 15 rain days (184h) 144h sun
Thermal 1
Sky 6
Rain 5
Wind 10
Higher = better, including rain & wind (green = "doesn't hurt the score", not "lots of it").
May 4/10
feels 1°C
(−1°C vs 2020-2024) · HCI 36/100
Day 4° · Night -1°
89% humidity 11 km/h wind 13 rain days (163h) 105h sun
Thermal 0
Sky 5
Rain 5
Wind 10
Higher = better, including rain & wind (green = "doesn't hurt the score", not "lots of it").
June 3/10
feels -2°C
(−1°C vs 2020-2024) · HCI 33/100
Day 1° · Night -3°
90% humidity 11 km/h wind 13 rain days (168h) 82h sun
Thermal 0
Sky 4
Rain 5
Wind 9
Higher = better, including rain & wind (green = "doesn't hurt the score", not "lots of it").
July 3/10
feels -3°C
(−1°C vs 2020-2024) · HCI 35/100
Day 1° · Night -4°
89% humidity 11 km/h wind 13 rain days (162h) 94h sun
Thermal 0
Sky 4
Rain 5
Wind 10
Higher = better, including rain & wind (green = "doesn't hurt the score", not "lots of it").
August 4/10
feels -2°C
(−1°C vs 2020-2024) · HCI 39/100
Day 2° · Night -3°
87% humidity 12 km/h wind 12 rain days (162h) 143h sun
Thermal 0
Sky 6
Rain 6
Wind 10
Higher = better, including rain & wind (green = "doesn't hurt the score", not "lots of it").
September 4/10
feels 1°C
· HCI 39/100
Day 4° · Night -1°
82% humidity 13 km/h wind 13 rain days (162h) 194h sun
Thermal 0
Sky 6
Rain 5
Wind 10
Higher = better, including rain & wind (green = "doesn't hurt the score", not "lots of it").
October 4/10
feels 3°C
(−1°C vs 2020-2024) · HCI 37/100
Day 7° · Night 0°
75% humidity 15 km/h wind 15 rain days (182h) 250h sun
Thermal 1
Sky 6
Rain 5
Wind 10
Higher = better, including rain & wind (green = "doesn't hurt the score", not "lots of it").
November 3/10
feels 6°C
(−1°C vs 2020-2024) · HCI 32/100
Day 10° · Night 2°
68% humidity 17 km/h wind 19 rain days (242h) 272h sun
Thermal 2
Sky 3
Rain 2
Wind 10
Higher = better, including rain & wind (green = "doesn't hurt the score", not "lots of it").
December 3/10
feels 8°C
· HCI 29/100
Day 11° · Night 4°
67% humidity 17 km/h wind 22 rain days (279h) 287h sun
Thermal 3
Sky 2
Rain 1
Wind 10
Higher = better, including rain & wind (green = "doesn't hurt the score", not "lots of it").
January 1–10 3/10
feels 10°C
(+1°C vs 2020-2024) · HCI 32/100
Day 12° · Night 5°
67% humidity 17 km/h wind 7 rain days (92h) 92h sun
Thermal 3
Sky 2
Rain 1
Wind 10
Higher = better, including rain & wind (green = "doesn't hurt the score", not "lots of it").
January 11–20 3/10
feels 9°C
· HCI 31/100
Day 12° · Night 5°
68% humidity 18 km/h wind 7 rain days (92h) 82h sun
Thermal 3
Sky 2
Rain 1
Wind 10
Higher = better, including rain & wind (green = "doesn't hurt the score", not "lots of it").
January 21–31 3/10
feels 10°C
· HCI 31/100
Day 13° · Night 6°
67% humidity 17 km/h wind 8 rain days (91h) 92h sun
Thermal 4
Sky 2
Rain 1
Wind 10
Higher = better, including rain & wind (green = "doesn't hurt the score", not "lots of it").
February 1–10 4/10
feels 10°C
(−2°C vs 2020-2024) · HCI 35/100
Day 12° · Night 5°
70% humidity 16 km/h wind 7 rain days (84h) 77h sun
Thermal 3
Sky 3
Rain 2
Wind 10
Higher = better, including rain & wind (green = "doesn't hurt the score", not "lots of it").
February 11–20 4/10
feels 10°C
(+1°C vs 2020-2024) · HCI 42/100
Day 12° · Night 5°
68% humidity 17 km/h wind 6 rain days (73h) 80h sun
Thermal 3
Sky 4
Rain 3
Wind 10
Higher = better, including rain & wind (green = "doesn't hurt the score", not "lots of it").
February 21–28 5/10
feels 9°C
(−1°C vs 2020-2024) · HCI 47/100
Day 12° · Night 5°
71% humidity 16 km/h wind 5 rain days (63h) 55h sun
Thermal 3
Sky 5
Rain 4
Wind 10
Higher = better, including rain & wind (green = "doesn't hurt the score", not "lots of it").
March 1–10 4/10
feels 9°C
· HCI 42/100
Day 12° · Night 5°
71% humidity 17 km/h wind 6 rain days (69h) 68h sun
Thermal 3
Sky 5
Rain 3
Wind 10
Higher = better, including rain & wind (green = "doesn't hurt the score", not "lots of it").
March 11–20 4/10
feels 7°C
(+1°C vs 2020-2024) · HCI 39/100
Day 10° · Night 4°
74% humidity 15 km/h wind 6 rain days (69h) 60h sun
Thermal 2
Sky 5
Rain 3
Wind 10
Higher = better, including rain & wind (green = "doesn't hurt the score", not "lots of it").
March 21–31 4/10
feels 7°C
(+1°C vs 2020-2024) · HCI 36/100
Day 10° · Night 3°
76% humidity 15 km/h wind 6 rain days (72h) 62h sun
Thermal 2
Sky 4
Rain 3
Wind 10
Higher = better, including rain & wind (green = "doesn't hurt the score", not "lots of it").
April 1–10 4/10
feels 6°C
(+1°C vs 2020-2024) · HCI 41/100
Day 9° · Night 2°
78% humidity 14 km/h wind 5 rain days (62h) 53h sun
Thermal 2
Sky 6
Rain 4
Wind 10
Higher = better, including rain & wind (green = "doesn't hurt the score", not "lots of it").
April 11–20 4/10
feels 4°C
(−2°C vs 2020-2024) · HCI 38/100
Day 7° · Night 2°
81% humidity 13 km/h wind 5 rain days (62h) 46h sun
Thermal 1
Sky 6
Rain 4
Wind 10
Higher = better, including rain & wind (green = "doesn't hurt the score", not "lots of it").
April 21–30 4/10
feels 3°C
· HCI 37/100
Day 6° · Night 1°
85% humidity 12 km/h wind 5 rain days (59h) 45h sun
Thermal 0
Sky 6
Rain 5
Wind 10
Higher = better, including rain & wind (green = "doesn't hurt the score", not "lots of it").
May 1–10 4/10
feels 2°C
(−1°C vs 2020-2024) · HCI 37/100
Day 5° · Night 0°
88% humidity 12 km/h wind 4 rain days (55h) 39h sun
Thermal 0
Sky 6
Rain 5
Wind 10
Higher = better, including rain & wind (green = "doesn't hurt the score", not "lots of it").
May 11–20 4/10
feels 1°C
(−2°C vs 2020-2024) · HCI 37/100
Day 4° · Night -1°
90% humidity 11 km/h wind 4 rain days (49h) 32h sun
Thermal 0
Sky 5
Rain 6
Wind 9
Higher = better, including rain & wind (green = "doesn't hurt the score", not "lots of it").
May 21–31 3/10
feels -1°C
(−1°C vs 2020-2024) · HCI 33/100
Day 2° · Night -2°
90% humidity 11 km/h wind 5 rain days (60h) 34h sun
Thermal 0
Sky 5
Rain 5
Wind 9
Higher = better, including rain & wind (green = "doesn't hurt the score", not "lots of it").
June 1–10 3/10
feels -2°C
(−1°C vs 2020-2024) · HCI 34/100
Day 1° · Night -3°
90% humidity 11 km/h wind 4 rain days (54h) 29h sun
Thermal 0
Sky 4
Rain 6
Wind 10
Higher = better, including rain & wind (green = "doesn't hurt the score", not "lots of it").
June 11–20 3/10
feels -2°C
(−1°C vs 2020-2024) · HCI 33/100
Day 1° · Night -3°
91% humidity 11 km/h wind 4 rain days (57h) 25h sun
Thermal 0
Sky 4
Rain 5
Wind 9
Higher = better, including rain & wind (green = "doesn't hurt the score", not "lots of it").
June 21–30 3/10
feels -3°C
(−1°C vs 2020-2024) · HCI 33/100
Day 0° · Night -4°
90% humidity 11 km/h wind 4 rain days (57h) 28h sun
Thermal 0
Sky 4
Rain 5
Wind 10
Higher = better, including rain & wind (green = "doesn't hurt the score", not "lots of it").
July 1–10 3/10
feels -3°C
(−1°C vs 2020-2024) · HCI 35/100
Day 0° · Night -4°
90% humidity 11 km/h wind 4 rain days (50h) 27h sun
Thermal 0
Sky 4
Rain 6
Wind 9
Higher = better, including rain & wind (green = "doesn't hurt the score", not "lots of it").
July 11–20 3/10
feels -3°C
(−1°C vs 2020-2024) · HCI 35/100
Day 1° · Night -4°
90% humidity 11 km/h wind 4 rain days (53h) 29h sun
Thermal 0
Sky 4
Rain 6
Wind 10
Higher = better, including rain & wind (green = "doesn't hurt the score", not "lots of it").
July 21–31 3/10
feels -3°C
(−1°C vs 2020-2024) · HCI 35/100
Day 1° · Night -4°
88% humidity 12 km/h wind 5 rain days (59h) 38h sun
Thermal 0
Sky 5
Rain 5
Wind 10
Higher = better, including rain & wind (green = "doesn't hurt the score", not "lots of it").
August 1–10 4/10
feels -2°C
(−1°C vs 2020-2024) · HCI 37/100
Day 2° · Night -3°
88% humidity 12 km/h wind 4 rain days (54h) 39h sun
Thermal 0
Sky 6
Rain 6
Wind 10
Higher = better, including rain & wind (green = "doesn't hurt the score", not "lots of it").
August 11–20 4/10
feels -2°C
(−1°C vs 2020-2024) · HCI 40/100
Day 1° · Night -4°
86% humidity 13 km/h wind 4 rain days (53h) 48h sun
Thermal 0
Sky 7
Rain 6
Wind 10
Higher = better, including rain & wind (green = "doesn't hurt the score", not "lots of it").
August 21–31 4/10
feels -1°C
(−1°C vs 2020-2024) · HCI 38/100
Day 2° · Night -3°
86% humidity 12 km/h wind 4 rain days (56h) 56h sun
Thermal 0
Sky 6
Rain 5
Wind 10
Higher = better, including rain & wind (green = "doesn't hurt the score", not "lots of it").
September 1–10 4/10
feels 0°C
(−1°C vs 2020-2024) · HCI 41/100
Day 3° · Night -2°
84% humidity 12 km/h wind 4 rain days (51h) 60h sun
Thermal 0
Sky 7
Rain 6
Wind 10
Higher = better, including rain & wind (green = "doesn't hurt the score", not "lots of it").
September 11–20 4/10
feels 0°C
· HCI 35/100
Day 4° · Night -2°
81% humidity 13 km/h wind 5 rain days (60h) 66h sun
Thermal 0
Sky 6
Rain 5
Wind 10
Higher = better, including rain & wind (green = "doesn't hurt the score", not "lots of it").
September 21–30 4/10
feels 2°C
(+1°C vs 2020-2024) · HCI 40/100
Day 5° · Night -1°
81% humidity 13 km/h wind 4 rain days (52h) 68h sun
Thermal 0
Sky 7
Rain 6
Wind 10
Higher = better, including rain & wind (green = "doesn't hurt the score", not "lots of it").
October 1–10 4/10
feels 3°C
(+1°C vs 2020-2024) · HCI 42/100
Day 6° · Night 0°
78% humidity 14 km/h wind 4 rain days (51h) 76h sun
Thermal 0
Sky 7
Rain 6
Wind 10
Higher = better, including rain & wind (green = "doesn't hurt the score", not "lots of it").
October 11–20 3/10
feels 3°C
(−1°C vs 2020-2024) · HCI 35/100
Day 6° · Night 0°
75% humidity 16 km/h wind 5 rain days (64h) 80h sun
Thermal 0
Sky 5
Rain 4
Wind 10
Higher = better, including rain & wind (green = "doesn't hurt the score", not "lots of it").
October 21–31 3/10
feels 4°C
(−1°C vs 2020-2024) · HCI 34/100
Day 7° · Night 1°
72% humidity 16 km/h wind 6 rain days (68h) 94h sun
Thermal 1
Sky 5
Rain 4
Wind 10
Higher = better, including rain & wind (green = "doesn't hurt the score", not "lots of it").
November 1–10 3/10
feels 6°C
(−2°C vs 2020-2024) · HCI 33/100
Day 9° · Night 2°
69% humidity 17 km/h wind 6 rain days (77h) 89h sun
Thermal 2
Sky 4
Rain 3
Wind 10
Higher = better, including rain & wind (green = "doesn't hurt the score", not "lots of it").
November 11–20 3/10
feels 7°C
· HCI 34/100
Day 10° · Night 3°
67% humidity 17 km/h wind 6 rain days (78h) 89h sun
Thermal 2
Sky 4
Rain 3
Wind 10
Higher = better, including rain & wind (green = "doesn't hurt the score", not "lots of it").
November 21–30 3/10
feels 7°C
· HCI 29/100
Day 10° · Night 3°
67% humidity 17 km/h wind 7 rain days (87h) 93h sun
Thermal 2
Sky 3
Rain 2
Wind 10
Higher = better, including rain & wind (green = "doesn't hurt the score", not "lots of it").
December 1–10 3/10
feels 8°C
(+1°C vs 2020-2024) · HCI 33/100
Day 11° · Night 4°
67% humidity 17 km/h wind 7 rain days (84h) 90h sun
Thermal 3
Sky 3
Rain 2
Wind 10
Higher = better, including rain & wind (green = "doesn't hurt the score", not "lots of it").
December 11–20 3/10
feels 8°C
(−1°C vs 2020-2024) · HCI 28/100
Day 11° · Night 4°
67% humidity 17 km/h wind 7 rain days (96h) 94h sun
Thermal 3
Sky 2
Rain 1
Wind 10
Higher = better, including rain & wind (green = "doesn't hurt the score", not "lots of it").
December 21–31 3/10
feels 9°C
(−1°C vs 2020-2024) · HCI 26/100
Day 12° · Night 4°
66% humidity 17 km/h wind 8 rain days (99h) 103h sun
Thermal 3
Sky 1
Rain 0
Wind 10
Higher = better, including rain & wind (green = "doesn't hurt the score", not "lots of it").
 Winter in Ushuaia: Lakes Escondido and Fagnano 4x4 tour with lunch
 Beagle Channel Navigation with Minitrekking
 Tierra del Fuego National Park – Small Groups. Optional Train
 Trekking Tour Laguna Esmeralda and Fuegian Valleys
 Beagle Channel Wildlife Cruise & Les Éclaireurs Lighthouse
 Low cost Ushuaia National Park Private tour