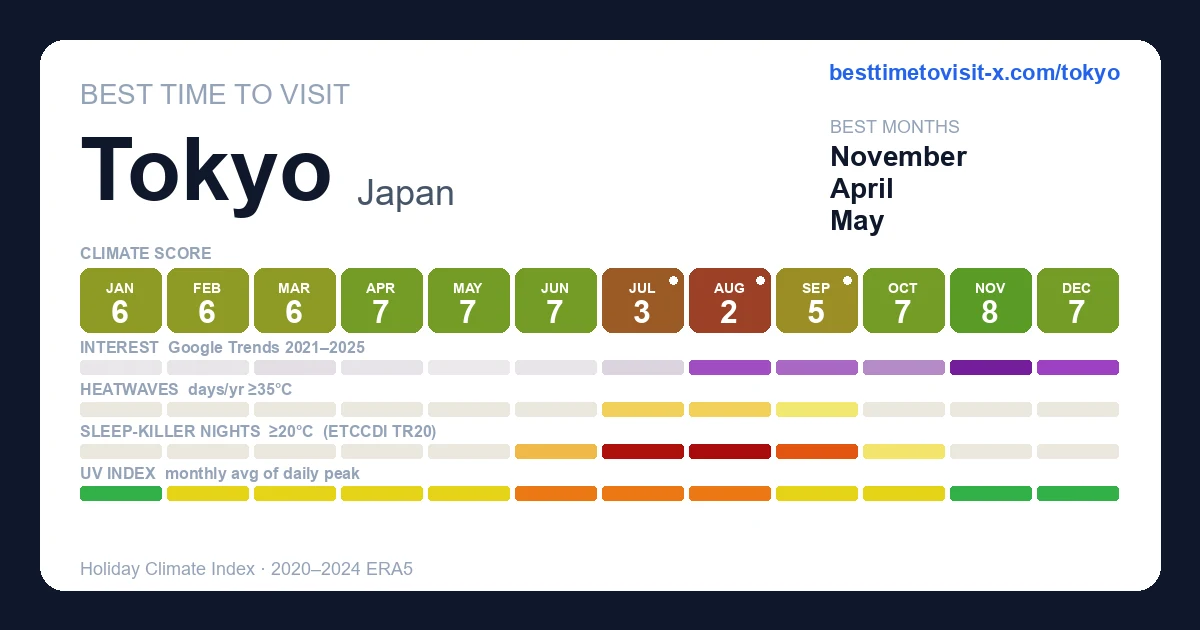
Best time to visit Tokyo
Re-score for me — drag the dial — every chart on the page recolours live for your heat limit 27°C
Default 27 °C is the upper edge of the Holiday Climate Index "ideal comfort" band (Scott, Rutty, Amelung & Tang, 2016). Above this, most warm-tourism travellers report measurable discomfort.
Greyed factors are scored normally — extreme heat overrides them, so a clear sky or low rain can't lift the period.
Greyed factors are scored normally — extreme heat overrides them, so a clear sky or low rain can't lift the period.
Greyed factors are scored normally — extreme heat overrides them, so a clear sky or low rain can't lift the period.
Greyed factors are scored normally — extreme heat overrides them, so a clear sky or low rain can't lift the period.
Greyed factors are scored normally — extreme heat overrides them, so a clear sky or low rain can't lift the period.
Greyed factors are scored normally — extreme heat overrides them, so a clear sky or low rain can't lift the period.
Greyed factors are scored normally — extreme heat overrides them, so a clear sky or low rain can't lift the period.
Greyed factors are scored normally — extreme heat overrides them, so a clear sky or low rain can't lift the period.
Greyed factors are scored normally — extreme heat overrides them, so a clear sky or low rain can't lift the period.
Greyed factors are scored normally — extreme heat overrides them, so a clear sky or low rain can't lift the period.
Greyed factors are scored normally — extreme heat overrides them, so a clear sky or low rain can't lift the period.
Greyed factors are scored normally — extreme heat overrides them, so a clear sky or low rain can't lift the period.
Greyed factors are scored normally — extreme heat overrides them, so a clear sky or low rain can't lift the period.
Greyed factors are scored normally — extreme heat overrides them, so a clear sky or low rain can't lift the period.
Greyed factors are scored normally — extreme heat overrides them, so a clear sky or low rain can't lift the period.
Greyed factors are scored normally — extreme heat overrides them, so a clear sky or low rain can't lift the period.
Greyed factors are scored normally — extreme heat overrides them, so a clear sky or low rain can't lift the period.
Greyed factors are scored normally — extreme heat overrides them, so a clear sky or low rain can't lift the period.
Greyed factors are scored normally — extreme heat overrides them, so a clear sky or low rain can't lift the period.
How is this scored? HCI / Steadman / CCI gate — full methodology and citations below.
Compare with another destination
Add as many as you like — stacked below the main strips above. Each row is just the recent-window score strip and (for beach destinations) sea-temperature strip.
Visit in late March to early May for cherry blossoms and mild weather, or October–November for crisp clear days and autumn foliage. Avoid late June through August: hot, humid, and rainy.
Tours in Tokyo
30 top-rated tours via Viator. Booking links earn this site a commission at no cost to you. Map locations are approximate (centred on Tokyo).
- 1
 Official Street Go-Kart Tour - Akihabara
 - 2
 Tokyo Shinjuku Sumo Show & Experience with Photo
 - 3
 Official Street Go-Kart in Shibuya
 - 4
 Shibuya Official Street Go-Kart in Shibuya Annex
 - 5
 Flagship 2-Hours Official Street Go-Kart Tour - Tokyo Bay Shop
 - 6
 Best of Tokyo Private Custom Tour: Tsukiji, Asakusa & Meiji-jingu
 - 7
 Official Street Go Kart Tour Akihabara 2nd
 - 8
 Private Tour to Mt. Fuji and Hakone (Fully Licensed Operator)
 - 9
 Mount Fuji Full Day Sightseeing Tour from Tokyo
 - 10
 Tokyo 6hr Private Tour with Government-Licensed Guide
 - 11
 Tokyo Customized Private Tour (Must See Places in 1 Day)
 - 12
 Tokyo Customized Private Tour: See Top Attractions in 1 Day
 - 13
 Tokyo Private Full-Day Tour by Car or Van
 - 14
 Private Tokyo Tour with a Local, Custom Highlights & Hidden Gems
 - 15
 Tokyo Go Kart Tour Asakusa, Skytree, and Akihabara **IDP MUST**
 - 16
 Mt Fuji & Hakone Cruise, Drum Show Bullet Train 1 Day from Tokyo
 - 17
 Tokyo 4hr Private Tour with Government-Licensed Guide
 - 18
 Tokyo Private Tour by Vehicle with English-Speaking Chauffeur
 - 19
 Private Tokyo Tour with English Speaking Driver
 - 20
 Private and Customisable Tokyo Tour with English-Speaking Driver
 - 21
 From Tokyo: Mount Fuji Sightseeing One Day Trip
 - 22
 Mt Fuji and Hakone 1-Day Bus Tour Return by Bullet Train
 - 23
 Tokyo: Sumo Entertainment Show with Chicken Hot Pot & Geisha
 - 24
 1-Day Tokyo Bus Tour
 - 25
 Tokyo: Shinjuku Food Tour (13 Dishes at 4 Local Eateries)
 - 26
 Nikko, Kegon Waterfall & Chuzenji Lake from Tokyo
 - 27
 Best of Shinjuku: Izakaya Food Tour (4 Stops, 14+ Tastings)
 - 28
 Sushi Making Tokyo Roll and Authentic Japanese Sushi Class
 - 29
 Best Samurai Experience in Tokyo
 - 30
 Tokyo Tsukiji Fish Market Food Walking Tour with 5 Tastings
Last refreshed 2026-05-25.
Similar climatesYokohama98% · Kamakura96% · Nagoya94%
Other destinations with the most-alike year-round climate to Tokyo (apparent temperature, rain hours, sunshine — matched within the same trip-profile). The ±N chip compares each match's typical score for the current month against Tokyo's. Based on the 2020-2024 climatology, not this year's actual weather.
Month-by-month
| Month | Temp °C | Feels °C | Rain days | Rain h | Rain h/day | Humidity | Wind km/h | Sun h | UV | Interest | Score |
|---|---|---|---|---|---|---|---|---|---|---|---|
| Jan | 0–9 | 4 | 6 | 73 | 12.2 | 53% | 27 | 173 | 2 | Quiet | 6 |
| Feb | 1–11 | 6 | 7 | 79 | 11.3 | 51% | 29 | 172 | 3 | Quiet | 6 |
| Mar | 5–15 | 11 | 12 | 134 | 11.2 | 55% | 31 | 187 | 4 | Quiet | 6 |
| Apr | 10–19 | 16 | 12 | 132 | 11.0 | 57% | 30 | 191 | 5 | Quiet | 7 |
| May | 14–23 | 21 | 13 | 158 | 12.2 | 62% | 29 | 191 | 6 | Quiet | 7 |
| Jun | 19–27 | 27 | 15 | 185 | 12.3 | 66% | 25 | 185 | 7 | Quiet | 7 |
| Jul | 23–31 | 33 | 18 | 221 | 12.3 | 66% | 25 | 199 | 8 | Quiet | 3 |
| Aug | 25–32 | 35 | 14 | 178 | 12.7 | 64% | 26 | 244 | 8 | Busy | 2 |
| Sep | 21–28 | 30 | 15 | 195 | 13.0 | 68% | 24 | 173 | 6 | Moderate | 5 |
| Oct | 14–22 | 21 | 12 | 147 | 12.3 | 65% | 23 | 164 | 4 | Moderate | 7 |
| Nov | 9–18 | 15 | 8 | 74 | 9.3 | 62% | 23 | 170 | 3 | Peak | 8 |
| Dec | 2–12 | 8 | 6 | 58 | 9.7 | 55% | 22 | 181 | 2 | Busy | 7 |
UV Index in Tokyo by Month
UV index in Tokyo peaks at 8 (high) in August, dropping to 2 (low) in December. June, July, August have high UV — SPF 30+ and sunglasses recommended.
Best months in detail
November
8/109–18°C (feels 15°C) · 8 rain days (74h) · 170 sun hours · 62% humidity · Peak crowd · UV 3 (low) · sunniest 1 in 10 days reach 4 (moderate)
Autumn foliage peaks in central Tokyo late November — Rikugien and Meiji Jingu Gaien are unmissable. Cool, clear, sunny.
October
7/1014–22°C (feels 21°C) · 12 rain days (147h) · 164 sun hours · 65% humidity · Moderate crowd · UV 4 (moderate) · sunniest 1 in 10 days reach 6 (moderate)
Genuine sweet spot: dry, clear, mild. Foliage begins late month in higher elevations (Nikko, Hakone).
May
7/1014–23°C (feels 21°C) · 13 rain days (158h) · 191 sun hours · 62% humidity · Quiet crowd · UV 6 (moderate) · sunniest 1 in 10 days reach 8 (very high)
After Golden Week (May 6), prices drop and weather is ideal. Comfortable temps, low humidity, before the rains.
Every month
Show the other 9 months in detail
January
6/100–9°C (feels 4°C) · 6 rain days (73h) · 173 sun hours · 53% humidity · Quiet crowd · UV 2 (low)
Cold, dry, sunny. Crowds thin. New Year shrine visits (hatsumode) in the first three days are massive — book onsen trips out of the city if you want quiet.
February
6/101–11°C (feels 6°C) · 7 rain days (79h) · 172 sun hours · 51% humidity · Quiet crowd · UV 3 (moderate)
Still cold and dry. Plum blossoms peak mid-to-late month at Yushima Tenmangu and Hanegi Park. Cheap flights.
March
6/105–15°C (feels 11°C) · 12 rain days (134h) · 187 sun hours · 55% humidity · Quiet crowd · UV 4 (moderate) · sunniest 1 in 10 days reach 5 (moderate)
Cherry blossoms typically open in the last week. Hanami crowds intensify the closer you get to peak bloom (usually March 25–April 5).
April
7/1010–19°C (feels 16°C) · 12 rain days (132h) · 191 sun hours · 57% humidity · Quiet crowd · UV 5 (moderate) · sunniest 1 in 10 days reach 7 (high)
Peak season. Cherry blossoms in the first week, then fresh greenery. Golden Week begins April 29 — domestic travel and accommodation costs spike.
June
7/1019–27°C · 15 rain days (185h) · 185 sun hours · 66% humidity · Quiet crowd · UV 7 (high) · sunniest 1 in 10 days reach 9 (very high)
Tsuyu (plum rains) begin early-to-mid June and last about six weeks. Bring rain gear. Hydrangeas bloom — Meigetsu-in in Kamakura is the photogenic spot.
July
3/1023–31°C (feels 33°C) · 18 rain days (221h) · 199 sun hours · 66% humidity · Quiet crowd · UV 8 (high) · sunniest 1 in 10 days reach 10 (very high)
Rains taper after mid-July; heat and humidity rise sharply. Sumida River fireworks (last Saturday of July) draw huge crowds.
August
2/1025–32°C (feels 35°C) · 14 rain days (178h) · 244 sun hours · 64% humidity · Busy crowd · UV 8 (high) · sunniest 1 in 10 days reach 10 (very high)
Hottest, most humid month. Daytime feels like 35°C+. Obon week (mid-August) closes many small businesses and crowds transport.
September
5/1021–28°C (feels 30°C) · 15 rain days (195h) · 173 sun hours · 68% humidity · Moderate crowd · UV 6 (moderate) · sunniest 1 in 10 days reach 8 (very high)
Typhoon risk peaks. Heat lingers early in the month then breaks. Avoid Silver Week (around Sept 19–23) for domestic crowds.
December
7/102–12°C (feels 8°C) · 6 rain days (58h) · 181 sun hours · 55% humidity · Busy crowd · UV 2 (low)
Cold but very dry and sunny. Illuminations everywhere. Year-end closures pick up after Dec 28.
Comparisons people search for
Pairs validated by Google Autocomplete demand — only pairs people actually compare.
Frequently asked questions about visiting Tokyo
When is the best time to visit Tokyo?
November is the highest-scoring month (8/10 on the Holiday Climate Index). Typical conditions: 9–18°C (8 rainy days). The top three months by score are November, October, May.
What is the worst time to visit Tokyo?
August is the lowest-scoring month (2/10, capped by extreme heat). Typical conditions: 25–32°C (14 rainy days).
Is Tokyo too hot in summer?
3 months (July, August, September) trip the heat deal-breaker in our scoring: apparent temperature crosses the comfort cap, so even with clear skies and low rain the score is held down. Plan around it if heat tolerance is low.
When are crowds lowest in Tokyo?
Search-interest seasonality (Google Trends 2021-2025) is lowest in May and peaks in November. Interest tracks both in-trip visitors and lead-time planners, so treat it as a "destination is on people's minds" signal rather than literal arrivals.
Which months in Tokyo have good weather but fewer tourists?
April (climate 7/10, crowd index 3) and May (climate 7/10, crowd index 0) — shoulder months with above-average climate and below-median search-interest. Often the best value-for-weather trade.
What is the UV index in Tokyo by month?
UV peaks at 8 (high) in August and is lowest in December at 2 (low). Monthly peak values: Jan 2, Feb 3, Mar 4, Apr 5, May 6, Jun 7, Jul 8, Aug 8, Sep 6, Oct 4, Nov 3, Dec 2.
What is the UV index in Tokyo in August?
August is the peak UV month in Tokyo, with a daily-peak UV index of 8 (high). Apply SPF 30+, wear sunglasses, and seek shade during midday hours.
How high can UV get in Tokyo on the sunniest days?
Most days look like the monthly average, but on the sunniest ~1 in 10 days UV climbs higher than the mean suggests. July is the worst case: typical days average UV 8 (high), but the top 10% of days reach UV 10 (very high) — and even higher. Months where the sunniest days routinely exceed the typical reading: March, April, May, June, July, August, September, October, November. Plan sun protection for the worst case, not the average.
Is air quality in Tokyo bad for travelers?
PM2.5 (fine-particle pollution) exceeds the WHO sensitive-group guideline (15 µg/m³) in 12 months: January, February, March, April, May, June, July, August, September, October, November, December. The worst month is December with a typical-day mean of 31 µg/m³ (unhealthy); on the worst 10% of days PM2.5 reaches 52 µg/m³ (hazardous) and higher. People with asthma, heart conditions, or sensitive children may want to avoid these months or limit outdoor activity. Source: CAMS via Open-Meteo.