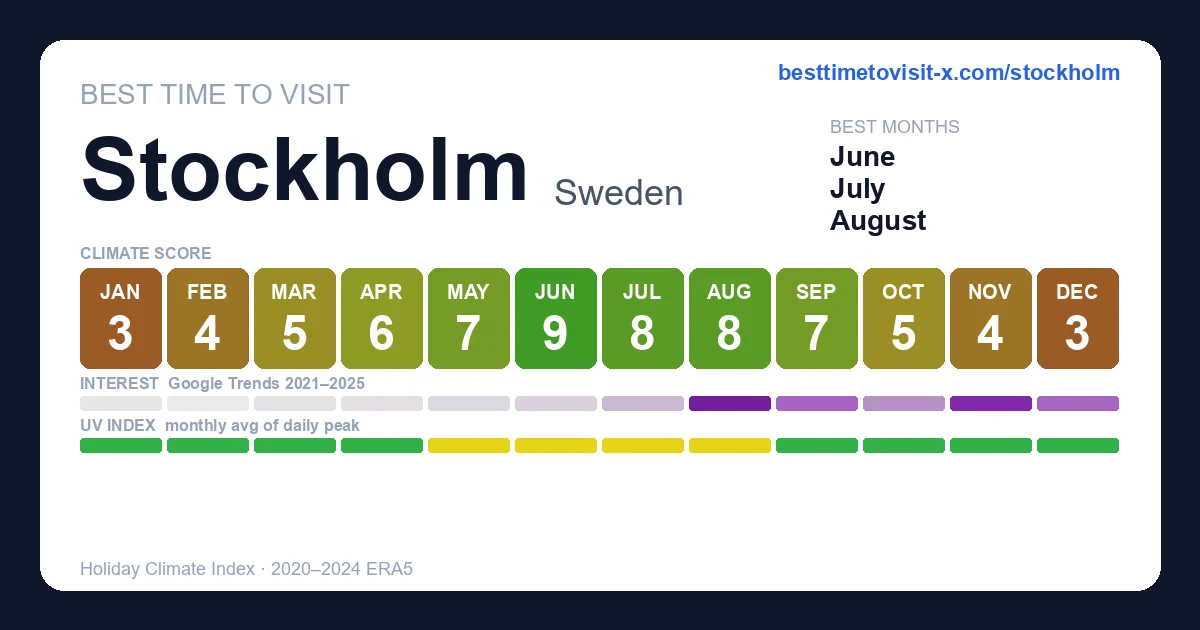
January 3/10
feels -3°C
(+1°C vs 1991-2020) · HCI 33/100
Day 2° · Night -3°
84% humidity 19 km/h wind 12 rain days (139h) 47h sun
Thermal 0
Sky 2
Rain 6
Wind 10
Higher = better, including rain & wind (green = "doesn't hurt the score", not "lots of it").
February 4/10
feels -2°C
(+2°C vs 1991-2020) · HCI 40/100
Day 2° · Night -3°
78% humidity 19 km/h wind 9 rain days (114h) 88h sun
Thermal 0
Sky 4
Rain 7
Wind 10
Higher = better, including rain & wind (green = "doesn't hurt the score", not "lots of it").
March 5/10
feels 2°C
(+3°C vs 1991-2020) · HCI 48/100
Day 6° · Night -2°
65% humidity 18 km/h wind 8 rain days (101h) 163h sun
Thermal 0
Sky 8
Rain 8
Wind 10
Higher = better, including rain & wind (green = "doesn't hurt the score", not "lots of it").
April 6/10
feels 5°C
· HCI 59/100
Day 9° · Night 0°
54% humidity 18 km/h wind 8 rain days (95h) 213h sun
Thermal 2
Sky 9
Rain 8
Wind 10
Higher = better, including rain & wind (green = "doesn't hurt the score", not "lots of it").
May 7/10
feels 13°C
(+2°C vs 1991-2020) · HCI 72/100
Day 16° · Night 5°
51% humidity 16 km/h wind 10 rain days (114h) 285h sun
Thermal 6
Sky 8
Rain 7
Wind 10
Higher = better, including rain & wind (green = "doesn't hurt the score", not "lots of it").
June 9/10
feels 21°C
(+5°C vs 1991-2020) · HCI 89/100
Day 22° · Night 12°
52% humidity 16 km/h wind 10 rain days (97h) 340h sun
Thermal 10
Sky 9
Rain 7
Wind 10
Higher = better, including rain & wind (green = "doesn't hurt the score", not "lots of it").
July 8/10
feels 21°C
(+1°C vs 1991-2020) · HCI 77/100
Day 22° · Night 13°
58% humidity 16 km/h wind 14 rain days (145h) 317h sun
Thermal 9
Sky 7
Rain 6
Wind 10
Higher = better, including rain & wind (green = "doesn't hurt the score", not "lots of it").
August 8/10
feels 21°C
(+2°C vs 1991-2020) · HCI 79/100
Day 21° · Night 13°
62% humidity 16 km/h wind 11 rain days (132h) 261h sun
Thermal 9
Sky 8
Rain 6
Wind 10
Higher = better, including rain & wind (green = "doesn't hurt the score", not "lots of it").
September 7/10
feels 15°C
(+1°C vs 1991-2020) · HCI 75/100
Day 17° · Night 10°
69% humidity 16 km/h wind 7 rain days (93h) 182h sun
Thermal 6
Sky 9
Rain 8
Wind 10
Higher = better, including rain & wind (green = "doesn't hurt the score", not "lots of it").
October 5/10
feels 9°C
(+3°C vs 1991-2020) · HCI 51/100
Day 11° · Night 6°
78% humidity 18 km/h wind 12 rain days (126h) 125h sun
Thermal 3
Sky 6
Rain 6
Wind 10
Higher = better, including rain & wind (green = "doesn't hurt the score", not "lots of it").
November 4/10
feels 2°C
(+1°C vs 1991-2020) · HCI 38/100
Day 6° · Night 1°
86% humidity 17 km/h wind 9 rain days (110h) 60h sun
Thermal 0
Sky 3
Rain 7
Wind 10
Higher = better, including rain & wind (green = "doesn't hurt the score", not "lots of it").
December 3/10
feels -3°C
· HCI 31/100
Day 1° · Night -3°
89% humidity 16 km/h wind 13 rain days (142h) 32h sun
Thermal 0
Sky 2
Rain 6
Wind 10
Higher = better, including rain & wind (green = "doesn't hurt the score", not "lots of it").
January 1–10 3/10
feels -4°C
· HCI 28/100
Day 1° · Night -3°
86% humidity 18 km/h wind 4 rain days (59h) 11h sun
Thermal 0
Sky 2
Rain 5
Wind 10
Higher = better, including rain & wind (green = "doesn't hurt the score", not "lots of it").
January 11–20 3/10
feels -2°C
(+2°C vs 1991-2020) · HCI 32/100
Day 2° · Night -3°
83% humidity 21 km/h wind 5 rain days (41h) 15h sun
Thermal 0
Sky 2
Rain 6
Wind 10
Higher = better, including rain & wind (green = "doesn't hurt the score", not "lots of it").
January 21–31 4/10
feels -2°C
(+3°C vs 1991-2020) · HCI 37/100
Day 2° · Night -2°
84% humidity 19 km/h wind 3 rain days (39h) 21h sun
Thermal 0
Sky 3
Rain 7
Wind 10
Higher = better, including rain & wind (green = "doesn't hurt the score", not "lots of it").
February 1–10 4/10
feels -4°C
· HCI 41/100
Day 1° · Night -5°
76% humidity 19 km/h wind 3 rain days (29h) 32h sun
Thermal 0
Sky 5
Rain 8
Wind 10
Higher = better, including rain & wind (green = "doesn't hurt the score", not "lots of it").
February 11–20 4/10
feels -1°C
(+3°C vs 1991-2020) · HCI 37/100
Day 3° · Night -3°
79% humidity 18 km/h wind 4 rain days (47h) 30h sun
Thermal 0
Sky 4
Rain 6
Wind 10
Higher = better, including rain & wind (green = "doesn't hurt the score", not "lots of it").
February 21–28 4/10
feels 0°C
(+4°C vs 1991-2020) · HCI 39/100
Day 4° · Night -2°
78% humidity 19 km/h wind 3 rain days (38h) 26h sun
Thermal 0
Sky 4
Rain 7
Wind 10
Higher = better, including rain & wind (green = "doesn't hurt the score", not "lots of it").
March 1–10 5/10
feels 0°C
(+2°C vs 1991-2020) · HCI 48/100
Day 4° · Night -2°
68% humidity 17 km/h wind 2 rain days (32h) 48h sun
Thermal 0
Sky 7
Rain 8
Wind 10
Higher = better, including rain & wind (green = "doesn't hurt the score", not "lots of it").
March 11–20 5/10
feels 2°C
(+3°C vs 1991-2020) · HCI 49/100
Day 6° · Night -2°
67% humidity 18 km/h wind 2 rain days (32h) 52h sun
Thermal 0
Sky 7
Rain 8
Wind 10
Higher = better, including rain & wind (green = "doesn't hurt the score", not "lots of it").
March 21–31 5/10
feels 3°C
(+2°C vs 1991-2020) · HCI 51/100
Day 7° · Night -1°
61% humidity 19 km/h wind 3 rain days (37h) 63h sun
Thermal 1
Sky 8
Rain 7
Wind 10
Higher = better, including rain & wind (green = "doesn't hurt the score", not "lots of it").
April 1–10 5/10
feels 3°C
· HCI 49/100
Day 7° · Night -2°
58% humidity 20 km/h wind 4 rain days (35h) 64h sun
Thermal 0
Sky 9
Rain 7
Wind 10
Higher = better, including rain & wind (green = "doesn't hurt the score", not "lots of it").
April 11–20 6/10
feels 7°C
(+2°C vs 1991-2020) · HCI 65/100
Day 11° · Night 1°
52% humidity 18 km/h wind 3 rain days (25h) 74h sun
Thermal 3
Sky 10
Rain 8
Wind 10
Higher = better, including rain & wind (green = "doesn't hurt the score", not "lots of it").
April 21–30 6/10
feels 6°C
(−2°C vs 1991-2020) · HCI 61/100
Day 10° · Night 1°
53% humidity 17 km/h wind 2 rain days (35h) 74h sun
Thermal 2
Sky 9
Rain 8
Wind 10
Higher = better, including rain & wind (green = "doesn't hurt the score", not "lots of it").
May 1–10 6/10
feels 9°C
· HCI 62/100
Day 12° · Night 3°
54% humidity 17 km/h wind 3 rain days (40h) 79h sun
Thermal 4
Sky 8
Rain 7
Wind 10
Higher = better, including rain & wind (green = "doesn't hurt the score", not "lots of it").
May 11–20 8/10
feels 14°C
(+3°C vs 1991-2020) · HCI 77/100
Day 17° · Night 6°
48% humidity 16 km/h wind 3 rain days (32h) 100h sun
Thermal 7
Sky 9
Rain 8
Wind 10
Higher = better, including rain & wind (green = "doesn't hurt the score", not "lots of it").
May 21–31 8/10
feels 16°C
(+3°C vs 1991-2020) · HCI 76/100
Day 18° · Night 7°
52% humidity 15 km/h wind 3 rain days (42h) 106h sun
Thermal 7
Sky 8
Rain 7
Wind 10
Higher = better, including rain & wind (green = "doesn't hurt the score", not "lots of it").
June 1–10 8/10
feels 18°C
(+2°C vs 1991-2020) · HCI 85/100
Day 20° · Night 10°
50% humidity 16 km/h wind 3 rain days (34h) 112h sun
Thermal 9
Sky 9
Rain 7
Wind 10
Higher = better, including rain & wind (green = "doesn't hurt the score", not "lots of it").
June 11–20 9/10
feels 20°C
(+4°C vs 1991-2020) · HCI 87/100
Day 22° · Night 11°
52% humidity 17 km/h wind 4 rain days (35h) 115h sun
Thermal 10
Sky 9
Rain 7
Wind 10
Higher = better, including rain & wind (green = "doesn't hurt the score", not "lots of it").
June 21–30 9/10
feels 24°C
(+7°C vs 1991-2020) · HCI 91/100
Day 25° · Night 14°
· cools 11° at night 53% humidity 14 km/h wind 3 rain days (29h) 113h sun
Thermal 10
Sky 9
Rain 8
Wind 10
Higher = better, including rain & wind (green = "doesn't hurt the score", not "lots of it").
July 1–10 7/10
feels 20°C
(+1°C vs 1991-2020) · HCI 70/100
Day 21° · Night 13°
61% humidity 18 km/h wind 5 rain days (59h) 102h sun
Thermal 9
Sky 6
Rain 5
Wind 10
Higher = better, including rain & wind (green = "doesn't hurt the score", not "lots of it").
July 11–20 8/10
feels 22°C
(+2°C vs 1991-2020) · HCI 85/100
Day 23° · Night 14°
56% humidity 16 km/h wind 4 rain days (36h) 104h sun
Thermal 9
Sky 9
Rain 7
Wind 10
Higher = better, including rain & wind (green = "doesn't hurt the score", not "lots of it").
July 21–31 8/10
feels 21°C
· HCI 77/100
Day 22° · Night 13°
57% humidity 15 km/h wind 5 rain days (50h) 111h sun
Thermal 9
Sky 7
Rain 5
Wind 10
Higher = better, including rain & wind (green = "doesn't hurt the score", not "lots of it").
August 1–10 8/10
feels 21°C
· HCI 76/100
Day 22° · Night 13°
62% humidity 16 km/h wind 4 rain days (50h) 90h sun
Thermal 9
Sky 7
Rain 6
Wind 10
Higher = better, including rain & wind (green = "doesn't hurt the score", not "lots of it").
August 11–20 9/10
feels 23°C
(+3°C vs 1991-2020) · HCI 89/100
Day 23° · Night 14°
60% humidity 16 km/h wind 3 rain days (26h) 89h sun
Thermal 9
Sky 10
Rain 8
Wind 10
Higher = better, including rain & wind (green = "doesn't hurt the score", not "lots of it").
August 21–31 7/10
feels 19°C
(+1°C vs 1991-2020) · HCI 70/100
Day 20° · Night 12°
64% humidity 17 km/h wind 4 rain days (55h) 83h sun
Thermal 8
Sky 6
Rain 5
Wind 10
Higher = better, including rain & wind (green = "doesn't hurt the score", not "lots of it").
September 1–10 8/10
feels 17°C
(+1°C vs 1991-2020) · HCI 82/100
Day 19° · Night 11°
65% humidity 15 km/h wind 2 rain days (29h) 74h sun
Thermal 7
Sky 9
Rain 8
Wind 10
Higher = better, including rain & wind (green = "doesn't hurt the score", not "lots of it").
September 11–20 7/10
feels 14°C
(+1°C vs 1991-2020) · HCI 70/100
Day 16° · Night 9°
69% humidity 17 km/h wind 3 rain days (31h) 54h sun
Thermal 5
Sky 8
Rain 8
Wind 10
Higher = better, including rain & wind (green = "doesn't hurt the score", not "lots of it").
September 21–30 7/10
feels 14°C
(+2°C vs 1991-2020) · HCI 68/100
Day 16° · Night 9°
72% humidity 16 km/h wind 3 rain days (34h) 54h sun
Thermal 5
Sky 8
Rain 7
Wind 10
Higher = better, including rain & wind (green = "doesn't hurt the score", not "lots of it").
October 1–10 5/10
feels 11°C
(+2°C vs 1991-2020) · HCI 54/100
Day 14° · Night 8°
77% humidity 19 km/h wind 4 rain days (53h) 44h sun
Thermal 4
Sky 6
Rain 6
Wind 10
Higher = better, including rain & wind (green = "doesn't hurt the score", not "lots of it").
October 11–20 6/10
feels 7°C
(+1°C vs 1991-2020) · HCI 57/100
Day 10° · Night 4°
73% humidity 19 km/h wind 3 rain days (27h) 52h sun
Thermal 2
Sky 7
Rain 8
Wind 10
Higher = better, including rain & wind (green = "doesn't hurt the score", not "lots of it").
October 21–31 4/10
feels 7°C
(+3°C vs 1991-2020) · HCI 44/100
Day 10° · Night 5°
84% humidity 18 km/h wind 4 rain days (46h) 29h sun
Thermal 2
Sky 4
Rain 6
Wind 10
Higher = better, including rain & wind (green = "doesn't hurt the score", not "lots of it").
November 1–10 4/10
feels 6°C
(+3°C vs 1991-2020) · HCI 40/100
Day 9° · Night 4°
88% humidity 17 km/h wind 4 rain days (46h) 22h sun
Thermal 1
Sky 3
Rain 6
Wind 10
Higher = better, including rain & wind (green = "doesn't hurt the score", not "lots of it").
November 11–20 4/10
feels 3°C
(+2°C vs 1991-2020) · HCI 43/100
Day 6° · Night 2°
83% humidity 17 km/h wind 2 rain days (25h) 21h sun
Thermal 0
Sky 3
Rain 9
Wind 10
Higher = better, including rain & wind (green = "doesn't hurt the score", not "lots of it").
November 21–30 4/10
feels -2°C
(−1°C vs 1991-2020) · HCI 36/100
Day 2° · Night -2°
86% humidity 17 km/h wind 3 rain days (39h) 17h sun
Thermal 0
Sky 2
Rain 7
Wind 10
Higher = better, including rain & wind (green = "doesn't hurt the score", not "lots of it").
December 1–10 3/10
feels -4°C
(−3°C vs 1991-2020) · HCI 33/100
Day 0° · Night -4°
88% humidity 14 km/h wind 3 rain days (39h) 10h sun
Thermal 0
Sky 1
Rain 7
Wind 10
Higher = better, including rain & wind (green = "doesn't hurt the score", not "lots of it").
December 11–20 3/10
feels -2°C
(+1°C vs 1991-2020) · HCI 30/100
Day 2° · Night -2°
88% humidity 18 km/h wind 5 rain days (43h) 9h sun
Thermal 0
Sky 1
Rain 6
Wind 10
Higher = better, including rain & wind (green = "doesn't hurt the score", not "lots of it").
December 21–31 3/10
feels -2°C
(+2°C vs 1991-2020) · HCI 26/100
Day 2° · Night -3°
90% humidity 18 km/h wind 6 rain days (60h) 14h sun
Thermal 0
Sky 2
Rain 4
Wind 10
Higher = better, including rain & wind (green = "doesn't hurt the score", not "lots of it").
 Stockholm at a Glance Bike Tour
 Open Electric Boat Ride in Stockholm with Live-Guide
 Stockholm Top attractions all-inclusive Grand Tour
 Stockholm Speed Boat 2 Hour Archipelago Tour
 RIB Speed Boat Tour and Archipelago Island Visit (4,5h)
 Stockholm Archipelago Tour by Kayak
 Stockholm Archipelago Sailing Day Tour
 Sunset Kayak Tour in Central Stockholm and Swedish Fika
 1-Day Small-Group Stockholm Archipelago Kayak Tour
 City Hall, Old Town & Vasa Museum - all-in-1 guided experience
 Stockholm Royal Palace Museums Gamla Stan Skip-the-line Tour
 Best of Stockholm: Small Group Walking Tour (Max 10, 3 Hours)
 Stockholm: Walking Tour of the Old Town
 Stockholm: Kayaking tour around Vaxholm Archipelago with Fika
 Stockholm: 2h Old Town Walking Tour + 2.5h Archipelago Cruise