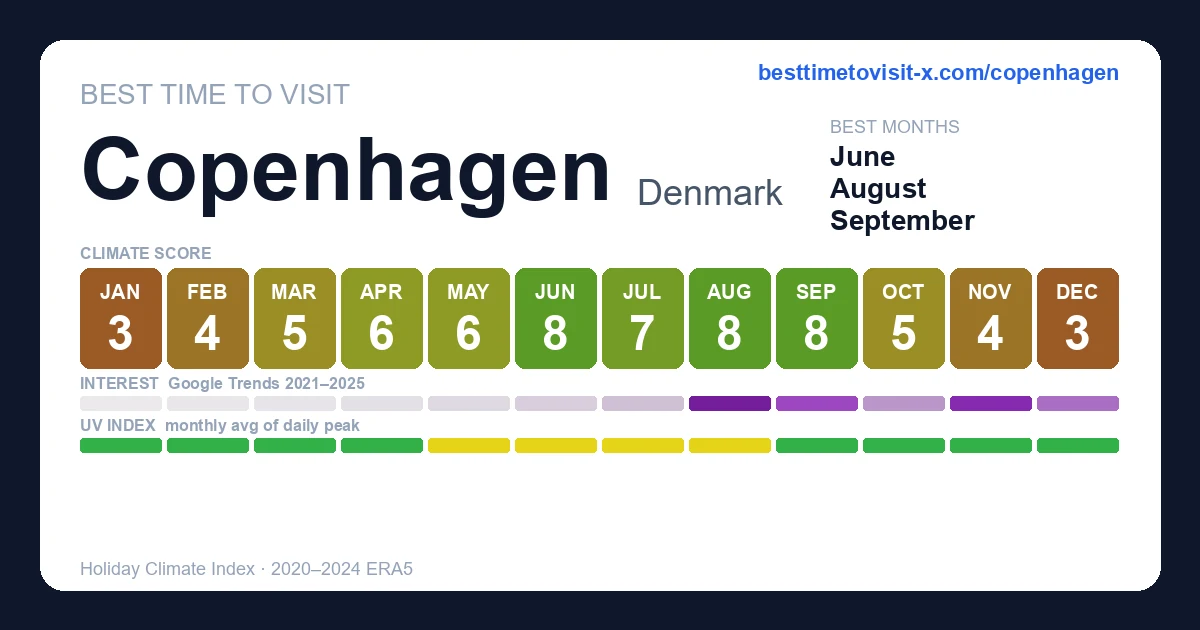
Best time to visit Copenhagen
Re-score for me — drag the dial — every chart on the page recolours live for your heat limit 27°C
Default 27 °C is the upper edge of the Holiday Climate Index "ideal comfort" band (Scott, Rutty, Amelung & Tang, 2016). Above this, most warm-tourism travellers report measurable discomfort.
How is this scored? HCI / Steadman / CCI gate — full methodology and citations below.
Compare with another destination
Add as many as you like — stacked below the main strips above. Each row is just the recent-window score strip and (for beach destinations) sea-temperature strip.
Tours in Copenhagen
19 top-rated tours via Viator. Booking links earn this site a commission at no cost to you.
- 1
 Copenhagen Culinary Food Tour with 6+ Tastings of Danish Classics
 - 2
 Original Copenhagen food tour: 8 tastings, full meal & VIP access
 - 3
 Copenhagen Highlights 3 Hour Bike Tour with local Guide
 - 4
 Social Sailing - Copenhagen Canal Tour - Captain's Favorite
 - 5
 3-hour Copenhagen City Highlights Bike Tour
 - 6
 Copenhagen Walking Tour: Politically Incorrect Intro
 - 7
 Private Copenhagen Family Cargo Bike Tour
 - 8
 Private Walking Grand Tour of Copenhagen
 - 9
 2-Hour Walking Introduction to Copenhagen and its Main Sights
 - 10
 Hamlet and Sweden Tour - Two Countries in one day !
 - 11
 Grand Day Trip around Copenhagen
 - 12
 Walk & Canal Tour: Copenhagen Highlights + Changing of the Guards
 - 13
 Best of Copenhagen: Small Group Walking Tour (Max 10, 3 Hours)
 - 14
 Good Morning, Copenhagen: Feel The Danish Hygge & Happiness
 - 15
 Politically Incorrect Beer Walk
 - 16
 Segway Tours Copenhagen w. Guide & Concierge Service. 2 Hours+
 - 17
 Home of Carlsberg entrance ticket + Guided cellar tour
 - 18
 Party Pub Crawl Copenhagen
 - 19
 Copenhagen for Cruise Ships: Highlights with Hassle-Free Pickup
Last refreshed 2026-05-30.
Similar climatesMalmö97% · Odense95% · Aarhus95%
Other destinations with the most-alike year-round climate to Copenhagen (apparent temperature, rain hours, sunshine — matched within the same trip-profile). The ±N chip compares each match's typical score for the current month against Copenhagen's. Based on the 2020-2024 climatology, not this year's actual weather.
Month-by-month
| Month | Temp °C | Feels °C | Rain days | Rain h | Rain h/day | Humidity | Wind km/h | Sun h | UV | Interest | Score |
|---|---|---|---|---|---|---|---|---|---|---|---|
| Jan | 1–5 | -1 | 14 | 149 | 10.6 | 85% | 31 | 68 | — | Quiet | 3 |
| Feb | 1–5 | 0 | 13 | 140 | 10.8 | 81% | 31 | 103 | 1 | Quiet | 4 |
| Mar | 2–7 | 2 | 10 | 108 | 10.8 | 74% | 26 | 173 | 2 | Quiet | 5 |
| Apr | 4–10 | 6 | 9 | 96 | 10.7 | 66% | 25 | 236 | 3 | Quiet | 6 |
| May | 9–15 | 12 | 11 | 122 | 11.1 | 68% | 24 | 283 | 4 | Quiet | 6 |
| Jun | 13–20 | 18 | 9 | 95 | 10.6 | 66% | 22 | 296 | 5 | Quiet | 8 |
| Jul | 15–20 | 18 | 14 | 148 | 10.6 | 67% | 24 | 284 | 4 | Quiet | 7 |
| Aug | 15–21 | 20 | 11 | 128 | 11.6 | 69% | 21 | 251 | 4 | Peak | 8 |
| Sep | 13–18 | 16 | 9 | 95 | 10.6 | 70% | 23 | 211 | 3 | Busy | 8 |
| Oct | 10–13 | 10 | 13 | 141 | 10.8 | 78% | 28 | 130 | 1 | Moderate | 5 |
| Nov | 6–9 | 4 | 11 | 126 | 11.5 | 82% | 27 | 69 | — | Peak | 4 |
| Dec | 2–5 | 0 | 14 | 170 | 12.1 | 86% | 28 | 41 | — | Moderate | 3 |
UV Index in Copenhagen by Month
UV index in Copenhagen peaks at 5 (moderate) in June, dropping to 0 (low) in January.
Best months in detail
June
8/1013–20°C (feels 18°C) · 9 rain days (95h) · 296 sun hours · 66% humidity · Quiet crowd · UV 5 (moderate) · sunniest 1 in 10 days reach 6 (high)
August
8/1015–21°C (feels 20°C) · 11 rain days (128h) · 251 sun hours · 69% humidity · Peak crowd · UV 4 (moderate)
September
8/1013–18°C (feels 16°C) · 9 rain days (95h) · 211 sun hours · 70% humidity · Busy crowd · UV 3 (low) · sunniest 1 in 10 days reach 4 (moderate)
Every month
Show the other 9 months in detail
January
3/101–5°C (feels -1°C) · 14 rain days (149h) · 68 sun hours · 85% humidity · Quiet crowd
February
4/101–5°C (feels 0°C) · 13 rain days (140h) · 103 sun hours · 81% humidity · Quiet crowd · UV 1 (low)
March
5/102–7°C (feels 2°C) · 10 rain days (108h) · 173 sun hours · 74% humidity · Quiet crowd · UV 2 (low)
April
6/104–10°C (feels 6°C) · 9 rain days (96h) · 236 sun hours · 66% humidity · Quiet crowd · UV 3 (low) · sunniest 1 in 10 days reach 4 (moderate)
May
6/109–15°C (feels 12°C) · 11 rain days (122h) · 283 sun hours · 68% humidity · Quiet crowd · UV 4 (moderate)
July
7/1015–20°C (feels 18°C) · 14 rain days (148h) · 284 sun hours · 67% humidity · Quiet crowd · UV 4 (moderate)
October
5/1010–13°C (feels 10°C) · 13 rain days (141h) · 130 sun hours · 78% humidity · Moderate crowd · UV 1 (low)
November
4/106–9°C (feels 4°C) · 11 rain days (126h) · 69 sun hours · 82% humidity · Peak crowd
December
3/102–5°C (feels 0°C) · 14 rain days (170h) · 41 sun hours · 86% humidity · Moderate crowd
Frequently asked questions about visiting Copenhagen
When is the best time to visit Copenhagen?
June is the highest-scoring month (8/10 on the Holiday Climate Index). Typical conditions: 13–20°C (9 rainy days). The top three months by score are June, August, September.
What is the worst time to visit Copenhagen?
December is the lowest-scoring month (3/10). Typical conditions: 2–5°C (14 rainy days).
When are crowds lowest in Copenhagen?
Search-interest seasonality (Google Trends 2021-2025) is lowest in January and peaks in August. Interest tracks both in-trip visitors and lead-time planners, so treat it as a "destination is on people's minds" signal rather than literal arrivals.
Which months in Copenhagen have good weather but fewer tourists?
June (climate 8/10, crowd index 15) and July (climate 7/10, crowd index 22) — shoulder months with above-average climate and below-median search-interest. Often the best value-for-weather trade.
What is the UV index in Copenhagen by month?
UV peaks at 5 (moderate) in June and is lowest in January at 0 (low). Monthly peak values: Jan —, Feb 1, Mar 2, Apr 3, May 4, Jun 5, Jul 4, Aug 4, Sep 3, Oct 1, Nov —, Dec —.
What is the UV index in Copenhagen in June?
June is the peak UV month in Copenhagen, with a daily-peak UV index of 5 (moderate). Standard sun protection — sunglasses and light SPF — is recommended.
How high can UV get in Copenhagen on the sunniest days?
Most days look like the monthly average, but on the sunniest ~1 in 10 days UV climbs higher than the mean suggests. June is the worst case: typical days average UV 5 (moderate), but the top 10% of days reach UV 6 (high) — and even higher. Months where the sunniest days routinely exceed the typical reading: April, June, September. Plan sun protection for the worst case, not the average.
Is air quality in Copenhagen bad for travelers?
PM2.5 (fine-particle pollution) exceeds the WHO sensitive-group guideline (15 µg/m³) in 1 month: March. The worst month is March with a typical-day mean of 11 µg/m³ (moderate); on the worst 10% of days PM2.5 reaches 22 µg/m³ (unhealthy for sensitive) and higher. People with asthma, heart conditions, or sensitive children may want to avoid these months or limit outdoor activity. Source: CAMS via Open-Meteo.