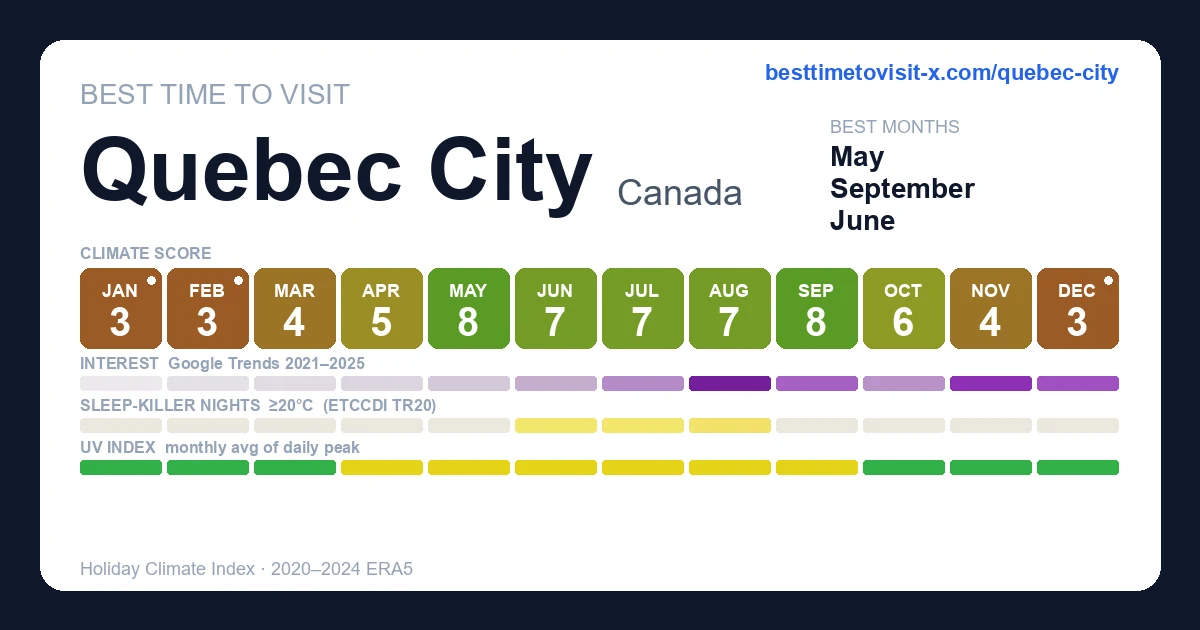
Best time to visit Quebec City
Re-score for me — drag the dial — every chart on the page recolours live for your heat limit 27°C
Default 27 °C is the upper edge of the Holiday Climate Index "ideal comfort" band (Scott, Rutty, Amelung & Tang, 2016). Above this, most warm-tourism travellers report measurable discomfort.
Greyed factors are scored normally — extreme cold overrides them, so a clear sky or low rain can't lift the period.
Greyed factors are scored normally — extreme cold overrides them, so a clear sky or low rain can't lift the period.
Greyed factors are scored normally — extreme cold overrides them, so a clear sky or low rain can't lift the period.
Greyed factors are scored normally — extreme cold overrides them, so a clear sky or low rain can't lift the period.
Greyed factors are scored normally — extreme cold overrides them, so a clear sky or low rain can't lift the period.
Greyed factors are scored normally — extreme cold overrides them, so a clear sky or low rain can't lift the period.
Greyed factors are scored normally — extreme cold overrides them, so a clear sky or low rain can't lift the period.
Greyed factors are scored normally — extreme cold overrides them, so a clear sky or low rain can't lift the period.
Greyed factors are scored normally — extreme cold overrides them, so a clear sky or low rain can't lift the period.
Greyed factors are scored normally — extreme cold overrides them, so a clear sky or low rain can't lift the period.
Greyed factors are scored normally — extreme cold overrides them, so a clear sky or low rain can't lift the period.
Greyed factors are scored normally — extreme cold overrides them, so a clear sky or low rain can't lift the period.
Greyed factors are scored normally — extreme cold overrides them, so a clear sky or low rain can't lift the period.
Greyed factors are scored normally — extreme cold overrides them, so a clear sky or low rain can't lift the period.
Greyed factors are scored normally — extreme cold overrides them, so a clear sky or low rain can't lift the period.
Greyed factors are scored normally — extreme cold overrides them, so a clear sky or low rain can't lift the period.
Greyed factors are scored normally — extreme cold overrides them, so a clear sky or low rain can't lift the period.
Greyed factors are scored normally — extreme cold overrides them, so a clear sky or low rain can't lift the period.
Greyed factors are scored normally — extreme cold overrides them, so a clear sky or low rain can't lift the period.
Greyed factors are scored normally — extreme cold overrides them, so a clear sky or low rain can't lift the period.
Greyed factors are scored normally — extreme cold overrides them, so a clear sky or low rain can't lift the period.
Greyed factors are scored normally — extreme cold overrides them, so a clear sky or low rain can't lift the period.
Greyed factors are scored normally — extreme cold overrides them, so a clear sky or low rain can't lift the period.
Greyed factors are scored normally — extreme cold overrides them, so a clear sky or low rain can't lift the period.
Greyed factors are scored normally — extreme cold overrides them, so a clear sky or low rain can't lift the period.
Greyed factors are scored normally — extreme cold overrides them, so a clear sky or low rain can't lift the period.
How is this scored? HCI / Steadman / CCI gate — full methodology and citations below.
Compare with another destination
Add as many as you like — stacked below the main strips above. Each row is just the recent-window score strip and (for beach destinations) sea-temperature strip.
Tours in Quebec City
12 top-rated tours via Viator. Booking links earn this site a commission at no cost to you. Map locations are approximate (centred on Quebec City).
- 1
 Old Quebec Classique Walking Tour with Funicular
 - 2
 Quebec City Walking Tour
 - 3
 Island of Orleans Taste and Drink Tour
 - 4
 Group Excursion of Quebec City and Montmorency Falls
 - 5
 Private Tour: Quebec City Walking Tour
 - 6
 Quebec City: Montmorency Falls and Microbrewery eBike Tour
 - 7
 Quebec City: E-Bike Tour to Grand Marché Local Life & Food Scene
 - 8
 Guided tour « from the bee to the bottle » with tasting - English
 - 9
 Old Quebec City Food Tour with 10+ Autentic Local Tastings
 - 10
 5 Course Gourmet Food and History Walking Tour of Old Quebec
 - 11
 Uncover Old Quebec: Fun Walking Tour with a guide-Gratuity based
 - 12
 Old Quebec Walking Tour with a Certified Local Guide
Last refreshed 2026-05-25.
Similar climatesAlgonquin Park94% · Montreal93% · Ottawa92%
Other destinations with the most-alike year-round climate to Quebec City (apparent temperature, rain hours, sunshine — matched within the same trip-profile). The ±N chip compares each match's typical score for the current month against Quebec City's. Based on the 2020-2024 climatology, not this year's actual weather.
Month-by-month
| Month | Temp °C | Feels °C | Rain days | Rain h | Rain h/day | Humidity | Wind km/h | Sun h | UV | Interest | Score |
|---|---|---|---|---|---|---|---|---|---|---|---|
| Jan | -14–-6 | -11 | 11 | 169 | 15.4 | 70% | 17 | 110 | 1 | Quiet | 3 |
| Feb | -14–-4 | -9 | 14 | 167 | 11.9 | 64% | 18 | 130 | 2 | Quiet | 3 |
| Mar | -7–2 | -3 | 12 | 159 | 13.3 | 61% | 19 | 162 | 3 | Quiet | 4 |
| Apr | -1–9 | 5 | 12 | 137 | 11.4 | 56% | 20 | 187 | 4 | Quiet | 5 |
| May | 7–18 | 15 | 11 | 123 | 11.2 | 50% | 19 | 247 | 5 | Quiet | 8 |
| Jun | 13–23 | 22 | 13 | 160 | 12.3 | 60% | 18 | 235 | 5 | Quiet | 7 |
| Jul | 16–25 | 26 | 17 | 183 | 10.8 | 65% | 17 | 262 | 6 | Moderate | 7 |
| Aug | 15–24 | 24 | 15 | 168 | 11.2 | 67% | 16 | 231 | 5 | Peak | 7 |
| Sep | 11–20 | 19 | 9 | 117 | 13.0 | 67% | 16 | 199 | 4 | Moderate | 8 |
| Oct | 5–13 | 11 | 11 | 138 | 12.5 | 69% | 16 | 152 | 2 | Moderate | 6 |
| Nov | -3–5 | 0 | 12 | 148 | 12.3 | 69% | 18 | 116 | 1 | Busy | 4 |
| Dec | -10–-1 | -6 | 13 | 204 | 15.7 | 73% | 18 | 93 | 1 | Busy | 3 |
UV Index in Quebec City by Month
UV index in Quebec City peaks at 6 (moderate) in July, dropping to 1 (low) in December.
Best months in detail
September
8/1011–20°C · 9 rain days (117h) · 199 sun hours · 67% humidity · Moderate crowd · UV 4 (moderate)
May
8/107–18°C (feels 15°C) · 11 rain days (123h) · 247 sun hours · 50% humidity · Quiet crowd · UV 5 (moderate) · sunniest 1 in 10 days reach 7 (high)
June
7/1013–23°C · 13 rain days (160h) · 235 sun hours · 60% humidity · Quiet crowd · UV 5 (moderate) · sunniest 1 in 10 days reach 7 (high)
Every month
Show the other 9 months in detail
January
3/10-14–-6°C (feels -11°C) · 11 rain days (169h) · 110 sun hours · 70% humidity · Quiet crowd · UV 1 (low)
February
3/10-14–-4°C (feels -9°C) · 14 rain days (167h) · 130 sun hours · 64% humidity · Quiet crowd · UV 2 (low)
March
4/10-7–2°C (feels -3°C) · 12 rain days (159h) · 162 sun hours · 61% humidity · Quiet crowd · UV 3 (low) · sunniest 1 in 10 days reach 4 (moderate)
April
5/10-1–9°C (feels 5°C) · 12 rain days (137h) · 187 sun hours · 56% humidity · Quiet crowd · UV 4 (moderate) · sunniest 1 in 10 days reach 6 (moderate)
July
7/1016–25°C · 17 rain days (183h) · 262 sun hours · 65% humidity · Moderate crowd · UV 6 (moderate) · sunniest 1 in 10 days reach 7 (high)
August
7/1015–24°C · 15 rain days (168h) · 231 sun hours · 67% humidity · Peak crowd · UV 5 (moderate) · sunniest 1 in 10 days reach 6 (high)
October
6/105–13°C (feels 11°C) · 11 rain days (138h) · 152 sun hours · 69% humidity · Moderate crowd · UV 2 (low) · sunniest 1 in 10 days reach 4 (moderate)
November
4/10-3–5°C (feels 0°C) · 12 rain days (148h) · 116 sun hours · 69% humidity · Busy crowd · UV 1 (low)
December
3/10-10–-1°C (feels -6°C) · 13 rain days (204h) · 93 sun hours · 73% humidity · Busy crowd · UV 1 (low)
Comparisons people search for
Pairs validated by Google Autocomplete demand — only pairs people actually compare.
Frequently asked questions about visiting Quebec City
When is the best time to visit Quebec City?
September is the highest-scoring month (8/10 on the Holiday Climate Index). Typical conditions: 11–20°C (9 rainy days). The top three months by score are September, May, June.
What is the worst time to visit Quebec City?
January is the lowest-scoring month (3/10, capped by extreme cold). Typical conditions: -14–-6°C (11 rainy days).
Is Quebec City too cold in winter?
3 months (January, February, December) cross our cold deal-breaker (apparent temperature below the cap). Doable with the right gear, but expect the climate score to be held down by the gate.
When are crowds lowest in Quebec City?
Search-interest seasonality (Google Trends 2021-2025) is lowest in January and peaks in August. Interest tracks both in-trip visitors and lead-time planners, so treat it as a "destination is on people's minds" signal rather than literal arrivals.
Which months in Quebec City have good weather but fewer tourists?
May (climate 8/10, crowd index 18) and June (climate 7/10, crowd index 31) — shoulder months with above-average climate and below-median search-interest. Often the best value-for-weather trade.
What is the UV index in Quebec City by month?
UV peaks at 6 (moderate) in July and is lowest in December at 1 (low). Monthly peak values: Jan 1, Feb 2, Mar 3, Apr 4, May 5, Jun 5, Jul 6, Aug 5, Sep 4, Oct 2, Nov 1, Dec 1.
What is the UV index in Quebec City in July?
July is the peak UV month in Quebec City, with a daily-peak UV index of 6 (moderate). Standard sun protection — sunglasses and light SPF — is recommended.
How high can UV get in Quebec City on the sunniest days?
Most days look like the monthly average, but on the sunniest ~1 in 10 days UV climbs higher than the mean suggests. June is the worst case: typical days average UV 5 (moderate), but the top 10% of days reach UV 7 (high) — and even higher. Months where the sunniest days routinely exceed the typical reading: March, April, May, June, July, August, October. Plan sun protection for the worst case, not the average.
Is air quality in Quebec City bad for travelers?
PM2.5 (fine-particle pollution) exceeds the WHO sensitive-group guideline (15 µg/m³) in 9 months: January, February, March, April, June, July, August, September, December. The worst month is July with a typical-day mean of 14 µg/m³ (moderate); on the worst 10% of days PM2.5 reaches 20 µg/m³ (unhealthy for sensitive) and higher. People with asthma, heart conditions, or sensitive children may want to avoid these months or limit outdoor activity. Source: CAMS via Open-Meteo.