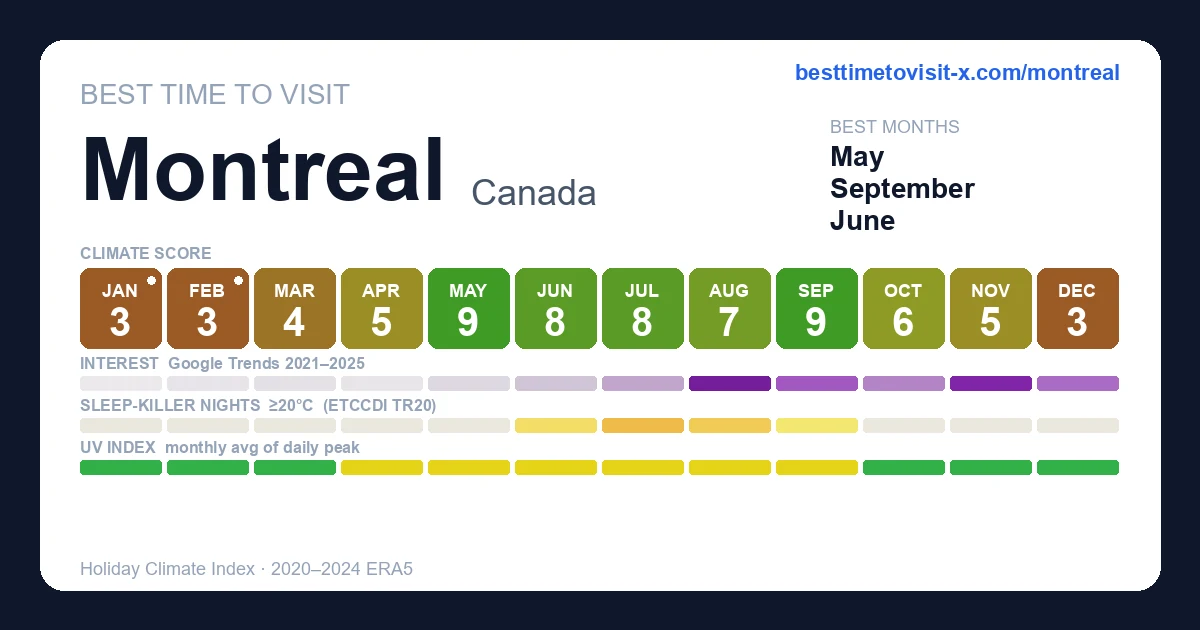
Best time to visit Montreal
Re-score for me — drag the dial — every chart on the page recolours live for your heat limit 27°C
Default 27 °C is the upper edge of the Holiday Climate Index "ideal comfort" band (Scott, Rutty, Amelung & Tang, 2016). Above this, most warm-tourism travellers report measurable discomfort.
Greyed factors are scored normally — extreme cold overrides them, so a clear sky or low rain can't lift the period.
Greyed factors are scored normally — extreme cold overrides them, so a clear sky or low rain can't lift the period.
Greyed factors are scored normally — extreme cold overrides them, so a clear sky or low rain can't lift the period.
Greyed factors are scored normally — extreme cold overrides them, so a clear sky or low rain can't lift the period.
Greyed factors are scored normally — extreme cold overrides them, so a clear sky or low rain can't lift the period.
Greyed factors are scored normally — extreme cold overrides them, so a clear sky or low rain can't lift the period.
Greyed factors are scored normally — extreme cold overrides them, so a clear sky or low rain can't lift the period.
Greyed factors are scored normally — extreme cold overrides them, so a clear sky or low rain can't lift the period.
Greyed factors are scored normally — extreme cold overrides them, so a clear sky or low rain can't lift the period.
Greyed factors are scored normally — extreme cold overrides them, so a clear sky or low rain can't lift the period.
Greyed factors are scored normally — extreme cold overrides them, so a clear sky or low rain can't lift the period.
Greyed factors are scored normally — extreme cold overrides them, so a clear sky or low rain can't lift the period.
Greyed factors are scored normally — extreme cold overrides them, so a clear sky or low rain can't lift the period.
Greyed factors are scored normally — extreme cold overrides them, so a clear sky or low rain can't lift the period.
Greyed factors are scored normally — extreme cold overrides them, so a clear sky or low rain can't lift the period.
Greyed factors are scored normally — extreme cold overrides them, so a clear sky or low rain can't lift the period.
Greyed factors are scored normally — extreme cold overrides them, so a clear sky or low rain can't lift the period.
Greyed factors are scored normally — extreme cold overrides them, so a clear sky or low rain can't lift the period.
Greyed factors are scored normally — extreme cold overrides them, so a clear sky or low rain can't lift the period.
Greyed factors are scored normally — extreme cold overrides them, so a clear sky or low rain can't lift the period.
How is this scored? HCI / Steadman / CCI gate — full methodology and citations below.
Compare with another destination
Add as many as you like — stacked below the main strips above. Each row is just the recent-window score strip and (for beach destinations) sea-temperature strip.
Tours in Montreal
20 top-rated tours via Viator. Booking links earn this site a commission at no cost to you. Map locations are approximate (centred on Montreal).
- 1
 Old Montreal Guided Food Tour with 8+ Local Delicacies Tastings
 - 2
 The Only Locally Owned Non-Touristy Food Tour by Spade & Palacio
 - 3
 The Essential 101 Non-Touristy Walking Tour by Spade & Palacio
 - 4
 The Original Montreal Mural Arts Tour by Spade & Palacio
 - 5
 Helicopter Tour Over Montreal
 - 6
 Quebec City and Montmorency Falls Day Trip from Montreal
 - 7
 Montreal City Sightseeing Tour with Live Commentary
 - 8
 Full-Day Quebec City Tour plus Sightseeing Cruise
 - 9
 Jet Boating Montreal's Lachine Rapids
 - 10
 Montreal Mile End Local Guided Food Tour by Local Montreal Tours
 - 11
 Montreal Authentic Food Tour with 7 Dishes in Trendy Mile End
 - 12
 Old Montreal Walking Tour | Small Group (Max 10) | by MTL Detours
 - 13
 The Full-Day small-group comprehensive tour of Montreal
 - 14
 Walking tour of Old Montreal - 16/42 Tours
 - 15
 Montreal eBike Sightseeing Tour
 - 16
 Toronto & Niagara Falls 2 Days Tour
 - 17
 Bike / E-bike tour : Plateau, Mile-End, Jean-Talon Market by Fitz
 - 18
 3 Day and 2 Night Tour: Toronto, 1000 Islands, and Niagara Falls
 - 19
 Nuns Island Montreal -Forfait Strøm détente authentique
 - 20
 Guided Speed Boating Tour on the St-Lawrence
Last refreshed 2026-05-25.
Similar climatesOttawa98% · Quebec City93% · Algonquin Park92%
Other destinations with the most-alike year-round climate to Montreal (apparent temperature, rain hours, sunshine — matched within the same trip-profile). The ±N chip compares each match's typical score for the current month against Montreal's. Based on the 2020-2024 climatology, not this year's actual weather.
Month-by-month
| Month | Temp °C | Feels °C | Rain days | Rain h | Rain h/day | Humidity | Wind km/h | Sun h | UV | Interest | Score |
|---|---|---|---|---|---|---|---|---|---|---|---|
| Jan | -12–-4 | -9 | 11 | 150 | 13.6 | 76% | 18 | 109 | 1 | Quiet | 3 |
| Feb | -12–-2 | -8 | 11 | 141 | 12.8 | 71% | 21 | 131 | 2 | Quiet | 3 |
| Mar | -5–4 | 0 | 11 | 145 | 13.2 | 61% | 22 | 176 | 3 | Quiet | 4 |
| Apr | 1–12 | 8 | 11 | 144 | 13.1 | 55% | 22 | 185 | 4 | Quiet | 5 |
| May | 9–20 | 17 | 8 | 89 | 11.1 | 49% | 20 | 252 | 5 | Quiet | 9 |
| Jun | 15–25 | 24 | 13 | 141 | 10.8 | 56% | 19 | 241 | 5 | Quiet | 8 |
| Jul | 18–27 | 28 | 13 | 139 | 10.7 | 61% | 18 | 271 | 6 | Quiet | 8 |
| Aug | 17–25 | 26 | 14 | 154 | 11.0 | 64% | 17 | 239 | 5 | Peak | 7 |
| Sep | 13–21 | 21 | 8 | 90 | 11.3 | 64% | 17 | 209 | 4 | Busy | 9 |
| Oct | 7–15 | 12 | 12 | 130 | 10.8 | 66% | 19 | 164 | 2 | Moderate | 6 |
| Nov | 0–7 | 3 | 10 | 107 | 10.7 | 65% | 20 | 128 | 1 | Peak | 5 |
| Dec | -6–1 | -4 | 13 | 177 | 13.6 | 71% | 20 | 92 | 1 | Moderate | 3 |
UV Index in Montreal by Month
UV index in Montreal peaks at 6 (moderate) in July, dropping to 1 (low) in December.
Best months in detail
May
9/109–20°C (feels 17°C) · 8 rain days (89h) · 252 sun hours · 49% humidity · Quiet crowd · UV 5 (moderate) · sunniest 1 in 10 days reach 7 (high)
September
9/1013–21°C · 8 rain days (90h) · 209 sun hours · 64% humidity · Busy crowd · UV 4 (moderate)
June
8/1015–25°C · 13 rain days (141h) · 241 sun hours · 56% humidity · Quiet crowd · UV 5 (moderate) · sunniest 1 in 10 days reach 8 (high)
Every month
Show the other 9 months in detail
January
3/10-12–-4°C (feels -9°C) · 11 rain days (150h) · 109 sun hours · 76% humidity · Quiet crowd · UV 1 (low)
February
3/10-12–-2°C (feels -8°C) · 11 rain days (141h) · 131 sun hours · 71% humidity · Quiet crowd · UV 2 (low)
March
4/10-5–4°C (feels 0°C) · 11 rain days (145h) · 176 sun hours · 61% humidity · Quiet crowd · UV 3 (low) · sunniest 1 in 10 days reach 4 (moderate)
April
5/101–12°C (feels 8°C) · 11 rain days (144h) · 185 sun hours · 55% humidity · Quiet crowd · UV 4 (moderate) · sunniest 1 in 10 days reach 6 (moderate)
July
8/1018–27°C · 13 rain days (139h) · 271 sun hours · 61% humidity · Quiet crowd · UV 6 (moderate) · sunniest 1 in 10 days reach 7 (high)
August
7/1017–25°C · 14 rain days (154h) · 239 sun hours · 64% humidity · Peak crowd · UV 5 (moderate) · sunniest 1 in 10 days reach 7 (high)
October
6/107–15°C (feels 12°C) · 12 rain days (130h) · 164 sun hours · 66% humidity · Moderate crowd · UV 2 (low) · sunniest 1 in 10 days reach 4 (moderate)
November
5/100–7°C (feels 3°C) · 10 rain days (107h) · 128 sun hours · 65% humidity · Peak crowd · UV 1 (low)
December
3/10-6–1°C (feels -4°C) · 13 rain days (177h) · 92 sun hours · 71% humidity · Moderate crowd · UV 1 (low)
Comparisons people search for
Pairs validated by Google Autocomplete demand — only pairs people actually compare.
Frequently asked questions about visiting Montreal
When is the best time to visit Montreal?
May is the highest-scoring month (9/10 on the Holiday Climate Index). Typical conditions: 9–20°C (8 rainy days). The top three months by score are May, September, June.
What is the worst time to visit Montreal?
January is the lowest-scoring month (3/10, capped by extreme cold). Typical conditions: -12–-4°C (11 rainy days).
Is Montreal too cold in winter?
2 months (January, February) cross our cold deal-breaker (apparent temperature below the cap). Doable with the right gear, but expect the climate score to be held down by the gate.
When are crowds lowest in Montreal?
Search-interest seasonality (Google Trends 2021-2025) is lowest in January and peaks in August. Interest tracks both in-trip visitors and lead-time planners, so treat it as a "destination is on people's minds" signal rather than literal arrivals.
Which months in Montreal have good weather but fewer tourists?
May (climate 9/10, crowd index 10) and June (climate 8/10, crowd index 20) — shoulder months with above-average climate and below-median search-interest. Often the best value-for-weather trade.
What is the UV index in Montreal by month?
UV peaks at 6 (moderate) in July and is lowest in December at 1 (low). Monthly peak values: Jan 1, Feb 2, Mar 3, Apr 4, May 5, Jun 5, Jul 6, Aug 5, Sep 4, Oct 2, Nov 1, Dec 1.
What is the UV index in Montreal in July?
July is the peak UV month in Montreal, with a daily-peak UV index of 6 (moderate). Standard sun protection — sunglasses and light SPF — is recommended.
How high can UV get in Montreal on the sunniest days?
Most days look like the monthly average, but on the sunniest ~1 in 10 days UV climbs higher than the mean suggests. June is the worst case: typical days average UV 5 (moderate), but the top 10% of days reach UV 8 (high) — and even higher. Months where the sunniest days routinely exceed the typical reading: March, April, May, June, July, August, October. Plan sun protection for the worst case, not the average.
Is air quality in Montreal bad for travelers?
PM2.5 (fine-particle pollution) exceeds the WHO sensitive-group guideline (15 µg/m³) in 10 months: January, February, March, April, May, June, July, August, September, December. The worst month is June with a typical-day mean of 18 µg/m³ (unhealthy for sensitive); on the worst 10% of days PM2.5 reaches 32 µg/m³ (unhealthy) and higher. People with asthma, heart conditions, or sensitive children may want to avoid these months or limit outdoor activity. Source: CAMS via Open-Meteo.