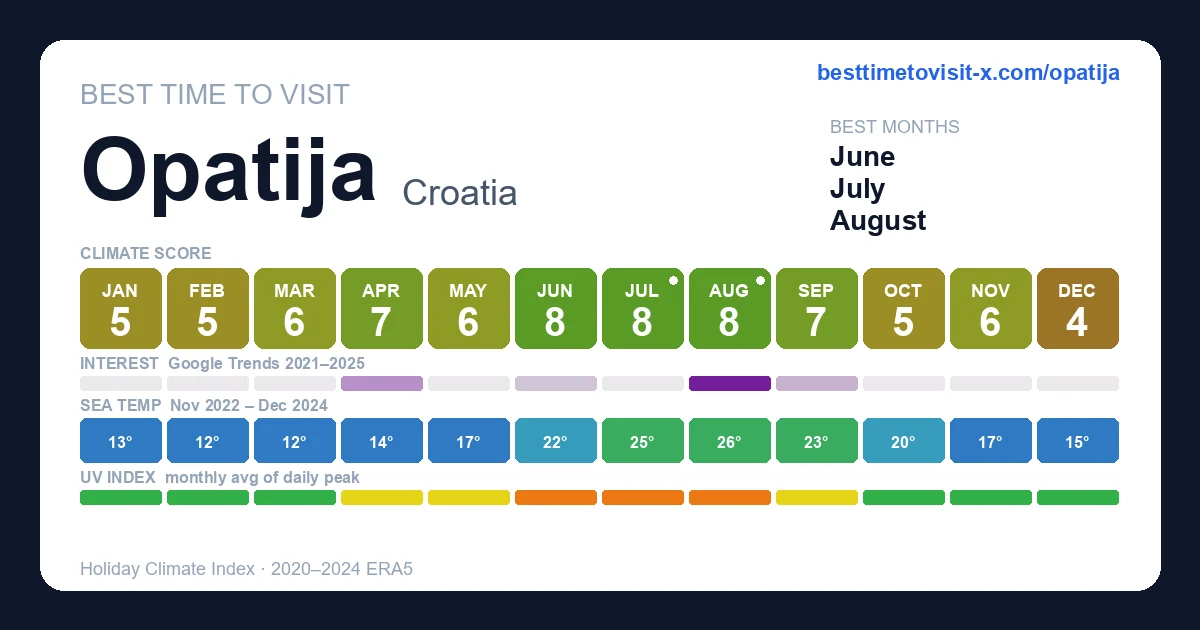
Best time to visit Opatija
Re-score for me — drag the dial — every chart recolours live for your heat & sea limits 27°C · sea 29°C
Default 27 °C is the upper edge of the Holiday Climate Index "ideal comfort" band (Scott, Rutty, Amelung & Tang, 2016). Above this, most warm-tourism travellers report measurable discomfort.
Default 29 °C is the Beach Climate Index "bathtub" line (Morgan et al.) — where the sea stops being refreshing and starts feeling like a warm bath.
Greyed factors are scored normally — extreme heat overrides them, so a clear sky or low rain can't lift the period.
Greyed factors are scored normally — extreme heat overrides them, so a clear sky or low rain can't lift the period.
Greyed factors are scored normally — extreme heat overrides them, so a clear sky or low rain can't lift the period.
Greyed factors are scored normally — extreme heat overrides them, so a clear sky or low rain can't lift the period.
Greyed factors are scored normally — extreme heat overrides them, so a clear sky or low rain can't lift the period.
Greyed factors are scored normally — extreme heat overrides them, so a clear sky or low rain can't lift the period.
Greyed factors are scored normally — extreme heat overrides them, so a clear sky or low rain can't lift the period.
Greyed factors are scored normally — extreme heat overrides them, so a clear sky or low rain can't lift the period.
How is this scored? HCI / Steadman / CCI gate — full methodology and citations below.
Compare with another destination
Add as many as you like — stacked below the main strips above. Each row is just the recent-window score strip and (for beach destinations) sea-temperature strip.
Similar climatesCinque Terre91% · Biarritz89% · Dubrovnik88%
Other destinations with the most-alike year-round climate to Opatija (apparent temperature, rain hours, sunshine — matched within the same trip-profile). The ±N chip compares each match's typical score for the current month against Opatija's. Based on the 2020-2024 climatology, not this year's actual weather.
Month-by-month
| Month | Temp °C | Feels °C | Rain days | Rain h | Rain h/day | Humidity | Wind km/h | Sun h | UV | Interest | Score |
|---|---|---|---|---|---|---|---|---|---|---|---|
| Jan | 3–10 | 6 | 12 | 196 | 16.3 | 70% | 16 | 128 | 1 | Quiet | 5 |
| Feb | 5–12 | 9 | 13 | 203 | 15.6 | 70% | 15 | 139 | 2 | Quiet | 5 |
| Mar | 5–13 | 10 | 10 | 164 | 16.4 | 60% | 17 | 203 | 3 | Quiet | 6 |
| Apr | 8–16 | 13 | 11 | 138 | 12.5 | 59% | 15 | 222 | 4 | Moderate | 7 |
| May | 13–20 | 20 | 14 | 184 | 13.1 | 64% | 16 | 254 | 5 | Quiet | 6 |
| Jun | 18–26 | 27 | 10 | 103 | 10.3 | 59% | 13 | 289 | 7 | Quiet | 8 |
| Jul | 20–29 | 30 | 8 | 64 | 8.0 | 49% | 14 | 311 | 7 | Quiet | 8 |
| Aug | 20–29 | 30 | 7 | 84 | 12.0 | 52% | 14 | 283 | 7 | Peak | 8 |
| Sep | 16–23 | 24 | 11 | 159 | 14.5 | 62% | 15 | 214 | 4 | Quiet | 7 |
| Oct | 13–19 | 19 | 13 | 232 | 17.8 | 73% | 15 | 177 | 3 | Quiet | 5 |
| Nov | 8–14 | 12 | 11 | 173 | 15.7 | 72% | 17 | 135 | 1 | Quiet | 6 |
| Dec | 5–11 | 8 | 15 | 243 | 16.2 | 76% | 16 | 99 | 1 | Quiet | 4 |
UV Index in Opatija by Month
UV index in Opatija peaks at 7 (high) in July, dropping to 1 (low) in January. June, July, August have high UV — SPF 30+ and sunglasses recommended.
Best months in detail
June
8/1018–26°C (feels 27°C) · 10 rain days (103h) · 289 sun hours · 59% humidity · Quiet crowd · UV 7 (high) · sunniest 1 in 10 days reach 8 (very high)
July
8/1020–29°C · 8 rain days (64h) · 311 sun hours · 49% humidity · Quiet crowd · UV 7 (high) · sunniest 1 in 10 days reach 9 (very high)
August
8/1020–29°C (feels 30°C) · 7 rain days (84h) · 283 sun hours · 52% humidity · Peak crowd · UV 7 (high)
Every month
Show the other 9 months in detail
January
5/103–10°C (feels 6°C) · 12 rain days (196h) · 128 sun hours · 70% humidity · Quiet crowd · UV 1 (low)
February
5/105–12°C (feels 9°C) · 13 rain days (203h) · 139 sun hours · 70% humidity · Quiet crowd · UV 2 (low)
March
6/105–13°C (feels 10°C) · 10 rain days (164h) · 203 sun hours · 60% humidity · Quiet crowd · UV 3 (low) · sunniest 1 in 10 days reach 4 (moderate)
April
7/108–16°C (feels 13°C) · 11 rain days (138h) · 222 sun hours · 59% humidity · Moderate crowd · UV 4 (moderate) · sunniest 1 in 10 days reach 6 (moderate)
May
6/1013–20°C · 14 rain days (184h) · 254 sun hours · 64% humidity · Quiet crowd · UV 5 (moderate) · sunniest 1 in 10 days reach 7 (high)
September
7/1016–23°C · 11 rain days (159h) · 214 sun hours · 62% humidity · Quiet crowd · UV 4 (moderate) · sunniest 1 in 10 days reach 6 (moderate)
October
5/1013–19°C · 13 rain days (232h) · 177 sun hours · 73% humidity · Quiet crowd · UV 3 (low) · sunniest 1 in 10 days reach 4 (moderate)
November
6/108–14°C (feels 12°C) · 11 rain days (173h) · 135 sun hours · 72% humidity · Quiet crowd · UV 1 (low)
December
4/105–11°C (feels 8°C) · 15 rain days (243h) · 99 sun hours · 76% humidity · Quiet crowd · UV 1 (low)
Frequently asked questions about visiting Opatija
When is the best time to visit Opatija?
June is the highest-scoring month (8/10 on the Holiday Climate Index). Typical conditions: 18–26°C (10 rainy days). The top three months by score are June, July, August.
What is the worst time to visit Opatija?
December is the lowest-scoring month (4/10). Typical conditions: 5–11°C (15 rainy days).
Is Opatija too hot in summer?
2 months (July, August) trip the heat deal-breaker in our scoring: apparent temperature crosses the comfort cap, so even with clear skies and low rain the score is held down. Plan around it if heat tolerance is low.
When are crowds lowest in Opatija?
Search-interest seasonality (Google Trends 2021-2025) is lowest in January and peaks in August. Interest tracks both in-trip visitors and lead-time planners, so treat it as a "destination is on people's minds" signal rather than literal arrivals.
Which months in Opatija have good weather but fewer tourists?
June (climate 8/10, crowd index 20) and July (climate 8/10, crowd index 0) — shoulder months with above-average climate and below-median search-interest. Often the best value-for-weather trade.
What is the UV index in Opatija by month?
UV peaks at 7 (high) in July and is lowest in January at 1 (low). Monthly peak values: Jan 1, Feb 2, Mar 3, Apr 4, May 5, Jun 7, Jul 7, Aug 7, Sep 4, Oct 3, Nov 1, Dec 1.
What is the UV index in Opatija in July?
July is the peak UV month in Opatija, with a daily-peak UV index of 7 (high). Apply SPF 30+, wear sunglasses, and seek shade during midday hours.
How high can UV get in Opatija on the sunniest days?
Most days look like the monthly average, but on the sunniest ~1 in 10 days UV climbs higher than the mean suggests. July is the worst case: typical days average UV 7 (high), but the top 10% of days reach UV 9 (very high) — and even higher. Months where the sunniest days routinely exceed the typical reading: March, April, May, June, July, September, October. Plan sun protection for the worst case, not the average.
Is air quality in Opatija bad for travelers?
PM2.5 (fine-particle pollution) exceeds the WHO sensitive-group guideline (15 µg/m³) in 5 months: January, February, March, October, December. The worst month is February with a typical-day mean of 15 µg/m³ (unhealthy for sensitive); on the worst 10% of days PM2.5 reaches 26 µg/m³ (unhealthy) and higher. People with asthma, heart conditions, or sensitive children may want to avoid these months or limit outdoor activity. Source: CAMS via Open-Meteo.