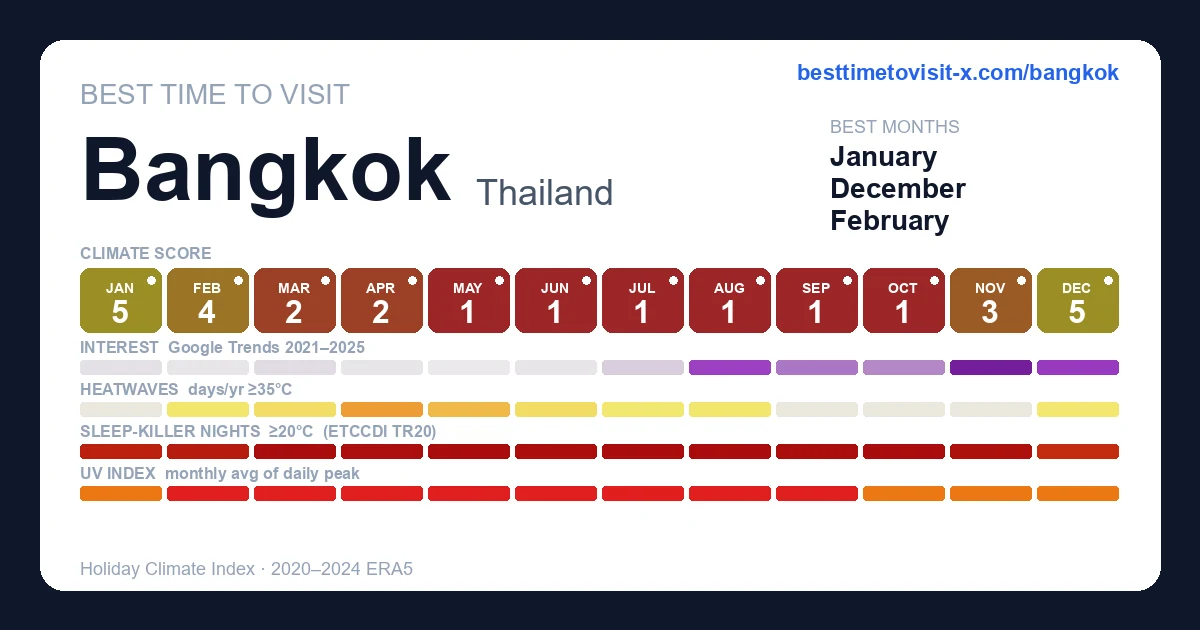
Best time to visit Bangkok
Re-score for me — drag the dial — every chart on the page recolours live for your heat limit 27°C
Default 27 °C is the upper edge of the Holiday Climate Index "ideal comfort" band (Scott, Rutty, Amelung & Tang, 2016). Above this, most warm-tourism travellers report measurable discomfort.
Greyed factors are scored normally — extreme heat overrides them, so a clear sky or low rain can't lift the period.
Greyed factors are scored normally — extreme heat overrides them, so a clear sky or low rain can't lift the period.
Greyed factors are scored normally — extreme heat overrides them, so a clear sky or low rain can't lift the period.
Greyed factors are scored normally — extreme heat overrides them, so a clear sky or low rain can't lift the period.
Greyed factors are scored normally — extreme heat overrides them, so a clear sky or low rain can't lift the period.
Greyed factors are scored normally — extreme heat overrides them, so a clear sky or low rain can't lift the period.
Greyed factors are scored normally — extreme heat overrides them, so a clear sky or low rain can't lift the period.
Greyed factors are scored normally — extreme heat overrides them, so a clear sky or low rain can't lift the period.
Greyed factors are scored normally — extreme heat overrides them, so a clear sky or low rain can't lift the period.
Greyed factors are scored normally — extreme heat overrides them, so a clear sky or low rain can't lift the period.
Greyed factors are scored normally — extreme heat overrides them, so a clear sky or low rain can't lift the period.
Greyed factors are scored normally — extreme heat overrides them, so a clear sky or low rain can't lift the period.
Greyed factors are scored normally — extreme heat overrides them, so a clear sky or low rain can't lift the period.
Greyed factors are scored normally — extreme heat overrides them, so a clear sky or low rain can't lift the period.
Greyed factors are scored normally — extreme heat overrides them, so a clear sky or low rain can't lift the period.
Greyed factors are scored normally — extreme heat overrides them, so a clear sky or low rain can't lift the period.
Greyed factors are scored normally — extreme heat overrides them, so a clear sky or low rain can't lift the period.
Greyed factors are scored normally — extreme heat overrides them, so a clear sky or low rain can't lift the period.
Greyed factors are scored normally — extreme heat overrides them, so a clear sky or low rain can't lift the period.
Greyed factors are scored normally — extreme heat overrides them, so a clear sky or low rain can't lift the period.
Greyed factors are scored normally — extreme heat overrides them, so a clear sky or low rain can't lift the period.
Greyed factors are scored normally — extreme heat overrides them, so a clear sky or low rain can't lift the period.
Greyed factors are scored normally — extreme heat overrides them, so a clear sky or low rain can't lift the period.
Greyed factors are scored normally — extreme heat overrides them, so a clear sky or low rain can't lift the period.
Greyed factors are scored normally — extreme heat overrides them, so a clear sky or low rain can't lift the period.
Greyed factors are scored normally — extreme heat overrides them, so a clear sky or low rain can't lift the period.
Greyed factors are scored normally — extreme heat overrides them, so a clear sky or low rain can't lift the period.
Greyed factors are scored normally — extreme heat overrides them, so a clear sky or low rain can't lift the period.
Greyed factors are scored normally — extreme heat overrides them, so a clear sky or low rain can't lift the period.
Greyed factors are scored normally — extreme heat overrides them, so a clear sky or low rain can't lift the period.
Greyed factors are scored normally — extreme heat overrides them, so a clear sky or low rain can't lift the period.
Greyed factors are scored normally — extreme heat overrides them, so a clear sky or low rain can't lift the period.
Greyed factors are scored normally — extreme heat overrides them, so a clear sky or low rain can't lift the period.
Greyed factors are scored normally — extreme heat overrides them, so a clear sky or low rain can't lift the period.
Greyed factors are scored normally — extreme heat overrides them, so a clear sky or low rain can't lift the period.
Greyed factors are scored normally — extreme heat overrides them, so a clear sky or low rain can't lift the period.
Greyed factors are scored normally — extreme heat overrides them, so a clear sky or low rain can't lift the period.
Greyed factors are scored normally — extreme heat overrides them, so a clear sky or low rain can't lift the period.
Greyed factors are scored normally — extreme heat overrides them, so a clear sky or low rain can't lift the period.
Greyed factors are scored normally — extreme heat overrides them, so a clear sky or low rain can't lift the period.
Greyed factors are scored normally — extreme heat overrides them, so a clear sky or low rain can't lift the period.
Greyed factors are scored normally — extreme heat overrides them, so a clear sky or low rain can't lift the period.
Greyed factors are scored normally — extreme heat overrides them, so a clear sky or low rain can't lift the period.
Greyed factors are scored normally — extreme heat overrides them, so a clear sky or low rain can't lift the period.
Greyed factors are scored normally — extreme heat overrides them, so a clear sky or low rain can't lift the period.
Greyed factors are scored normally — extreme heat overrides them, so a clear sky or low rain can't lift the period.
Greyed factors are scored normally — extreme heat overrides them, so a clear sky or low rain can't lift the period.
Greyed factors are scored normally — extreme heat overrides them, so a clear sky or low rain can't lift the period.
Greyed factors are scored normally — extreme heat overrides them, so a clear sky or low rain can't lift the period.
Greyed factors are scored normally — extreme heat overrides them, so a clear sky or low rain can't lift the period.
Greyed factors are scored normally — extreme heat overrides them, so a clear sky or low rain can't lift the period.
Greyed factors are scored normally — extreme heat overrides them, so a clear sky or low rain can't lift the period.
Greyed factors are scored normally — extreme heat overrides them, so a clear sky or low rain can't lift the period.
Greyed factors are scored normally — extreme heat overrides them, so a clear sky or low rain can't lift the period.
Greyed factors are scored normally — extreme heat overrides them, so a clear sky or low rain can't lift the period.
Greyed factors are scored normally — extreme heat overrides them, so a clear sky or low rain can't lift the period.
Greyed factors are scored normally — extreme heat overrides them, so a clear sky or low rain can't lift the period.
Greyed factors are scored normally — extreme heat overrides them, so a clear sky or low rain can't lift the period.
Greyed factors are scored normally — extreme heat overrides them, so a clear sky or low rain can't lift the period.
Greyed factors are scored normally — extreme heat overrides them, so a clear sky or low rain can't lift the period.
Greyed factors are scored normally — extreme heat overrides them, so a clear sky or low rain can't lift the period.
Greyed factors are scored normally — extreme heat overrides them, so a clear sky or low rain can't lift the period.
Greyed factors are scored normally — extreme heat overrides them, so a clear sky or low rain can't lift the period.
Greyed factors are scored normally — extreme heat overrides them, so a clear sky or low rain can't lift the period.
Greyed factors are scored normally — extreme heat overrides them, so a clear sky or low rain can't lift the period.
Greyed factors are scored normally — extreme heat overrides them, so a clear sky or low rain can't lift the period.
Greyed factors are scored normally — extreme heat overrides them, so a clear sky or low rain can't lift the period.
Greyed factors are scored normally — extreme heat overrides them, so a clear sky or low rain can't lift the period.
Greyed factors are scored normally — extreme heat overrides them, so a clear sky or low rain can't lift the period.
Greyed factors are scored normally — extreme heat overrides them, so a clear sky or low rain can't lift the period.
Greyed factors are scored normally — extreme heat overrides them, so a clear sky or low rain can't lift the period.
Greyed factors are scored normally — extreme heat overrides them, so a clear sky or low rain can't lift the period.
Greyed factors are scored normally — extreme heat overrides them, so a clear sky or low rain can't lift the period.
Greyed factors are scored normally — extreme heat overrides them, so a clear sky or low rain can't lift the period.
Greyed factors are scored normally — extreme heat overrides them, so a clear sky or low rain can't lift the period.
Greyed factors are scored normally — extreme heat overrides them, so a clear sky or low rain can't lift the period.
Greyed factors are scored normally — extreme heat overrides them, so a clear sky or low rain can't lift the period.
Greyed factors are scored normally — extreme heat overrides them, so a clear sky or low rain can't lift the period.
Greyed factors are scored normally — extreme heat overrides them, so a clear sky or low rain can't lift the period.
Greyed factors are scored normally — extreme heat overrides them, so a clear sky or low rain can't lift the period.
Greyed factors are scored normally — extreme heat overrides them, so a clear sky or low rain can't lift the period.
Greyed factors are scored normally — extreme heat overrides them, so a clear sky or low rain can't lift the period.
Greyed factors are scored normally — extreme heat overrides them, so a clear sky or low rain can't lift the period.
Greyed factors are scored normally — extreme heat overrides them, so a clear sky or low rain can't lift the period.
Greyed factors are scored normally — extreme heat overrides them, so a clear sky or low rain can't lift the period.
Greyed factors are scored normally — extreme heat overrides them, so a clear sky or low rain can't lift the period.
Greyed factors are scored normally — extreme heat overrides them, so a clear sky or low rain can't lift the period.
Greyed factors are scored normally — extreme heat overrides them, so a clear sky or low rain can't lift the period.
Greyed factors are scored normally — extreme heat overrides them, so a clear sky or low rain can't lift the period.
Greyed factors are scored normally — extreme heat overrides them, so a clear sky or low rain can't lift the period.
Greyed factors are scored normally — extreme heat overrides them, so a clear sky or low rain can't lift the period.
Greyed factors are scored normally — extreme heat overrides them, so a clear sky or low rain can't lift the period.
Greyed factors are scored normally — extreme heat overrides them, so a clear sky or low rain can't lift the period.
Greyed factors are scored normally — extreme heat overrides them, so a clear sky or low rain can't lift the period.
Greyed factors are scored normally — extreme heat overrides them, so a clear sky or low rain can't lift the period.
Greyed factors are scored normally — extreme heat overrides them, so a clear sky or low rain can't lift the period.
How is this scored? HCI / Steadman / CCI gate — full methodology and citations below.
Compare with another destination
Add as many as you like — stacked below the main strips above. Each row is just the recent-window score strip and (for beach destinations) sea-temperature strip.
Tours in Bangkok
20 top-rated tours via Viator. Booking links earn this site a commission at no cost to you. Map locations are approximate (centred on Bangkok).
- 1
 Bridge over River Kwai and Hellfire Pass Tour with Train Ride
 - 2
 Private Tour: Best of Bangkok in A Day
 - 3
 Floating and Railway Market (Optional Waterfall): Private Tour
 - 4
 Private Full Day Bangkok City Tour
 - 5
 Private Floating Market and Historical Ayutthaya Sightseeing Tour
 - 6
 Private Excursion to Ayutthaya, UNESCO World Heritage site with Boat Tour
 - 7
 Bangkok by Night: Temples, Markets and Food Tuk-Tuk Tour
 - 8
 Bangkok: Floating Market and Train Market Experience
 - 9
 Bangkok Backstreets Food Tour with 15+ Tastings
 - 10
 Hidden Bangkok Longtail Boat Tour to Big Buddha&Canal Life 2hrs
 - 11
 Bangkok Midnight Food Tuk Tuk Tour
 - 12
 Old Siam Bangkok Food Tour with 15+ Tastings
 - 13
 Experience Bangkok with typical Thai tuk-tuk
 - 14
 Manohra Cruise Luxury Dining
 - 15
 Bangkok's Most Authentic Guided Food Tour with 10+ Tastings
 - 16
 Damnoen Saduak Floating Market & Ayutthaya Tour from Bangkok
 - 17
 Must-Try: Hidden Bangkok Bike and Food Tour
 - 18
 Ayutthaya UNESCO Temples Small Group : Full Day Tour From Bangkok
 - 19
 Bangkok Private Highlights Tour with Local Guide
 - 20
 Bangkok: Rooftops, Clubs & Go Gos-Soi Cowboy, Soi 11 Night Tour
Last refreshed 2026-05-25.
Similar climatesLiberia82% · Kaohsiung81% · Orlando79%
Other destinations with the most-alike year-round climate to Bangkok (apparent temperature, rain hours, sunshine — matched within the same trip-profile). The ±N chip compares each match's typical score for the current month against Bangkok's. Based on the 2020-2024 climatology, not this year's actual weather.
Month-by-month
| Month | Temp °C | Feels °C | Rain days | Rain h | Rain h/day | Humidity | Wind km/h | Sun h | UV | Interest | Score |
|---|---|---|---|---|---|---|---|---|---|---|---|
| Jan | 22–32 | 34 | 3 | 29 | 9.7 | 47% | 13 | 249 | 8 | Quiet | 5 |
| Feb | 24–33 | 35 | 6 | 66 | 11.0 | 52% | 15 | 225 | 9 | Quiet | 4 |
| Mar | 26–33 | 37 | 9 | 86 | 9.6 | 57% | 17 | 249 | 10 | Quiet | 2 |
| Apr | 27–34 | 38 | 12 | 103 | 8.6 | 58% | 17 | 242 | 10 | Quiet | 2 |
| May | 27–34 | 39 | 20 | 175 | 8.8 | 63% | 17 | 233 | 9 | Quiet | 1 |
| Jun | 26–33 | 37 | 24 | 186 | 7.8 | 64% | 17 | 213 | 9 | Quiet | 1 |
| Jul | 26–32 | 37 | 27 | 271 | 10.0 | 70% | 17 | 185 | 9 | Quiet | 1 |
| Aug | 26–32 | 37 | 27 | 266 | 9.9 | 70% | 16 | 191 | 10 | Busy | 1 |
| Sep | 25–31 | 36 | 28 | 342 | 12.2 | 74% | 14 | 172 | 9 | Moderate | 1 |
| Oct | 24–31 | 35 | 22 | 265 | 12.0 | 71% | 13 | 193 | 8 | Moderate | 1 |
| Nov | 24–31 | 35 | 11 | 101 | 9.2 | 61% | 13 | 220 | 7 | Peak | 3 |
| Dec | 22–31 | 33 | 4 | 34 | 8.5 | 49% | 13 | 242 | 7 | Busy | 5 |
UV Index in Bangkok by Month
UV index in Bangkok peaks at 10 (very high) in August, dropping to 7 (high) in November. February, March, April, May, June, July, August, September reach very high or extreme levels — apply SPF 50+, wear a hat and protective clothing, and limit direct sun between 11:00 and 17:00.
Best months in detail
December
5/1022–31°C (feels 33°C) · 4 rain days (34h) · 242 sun hours · 49% humidity · Busy crowd · UV 7 (high) · sunniest 1 in 10 days reach 9 (very high)
January
5/1022–32°C (feels 34°C) · 3 rain days (29h) · 249 sun hours · 47% humidity · Quiet crowd · UV 8 (high) · sunniest 1 in 10 days reach 9 (very high)
February
4/1024–33°C (feels 35°C) · 6 rain days (66h) · 225 sun hours · 52% humidity · Quiet crowd · UV 9 (very high) · sunniest 1 in 10 days reach 10 (very high)
Every month
Show the other 9 months in detail
March
2/1026–33°C (feels 37°C) · 9 rain days (86h) · 249 sun hours · 57% humidity · Quiet crowd · UV 10 (very high) · sunniest 1 in 10 days reach 12 (extreme)
April
2/1027–34°C (feels 38°C) · 12 rain days (103h) · 242 sun hours · 58% humidity · Quiet crowd · UV 10 (very high) · sunniest 1 in 10 days reach 12 (extreme)
May
1/1027–34°C (feels 39°C) · 20 rain days (175h) · 233 sun hours · 63% humidity · Quiet crowd · UV 9 (very high) · sunniest 1 in 10 days reach 11 (very high)
June
1/1026–33°C (feels 37°C) · 24 rain days (186h) · 213 sun hours · 64% humidity · Quiet crowd · UV 9 (very high) · sunniest 1 in 10 days reach 11 (very high)
July
1/1026–32°C (feels 37°C) · 27 rain days (271h) · 185 sun hours · 70% humidity · Quiet crowd · UV 9 (very high) · sunniest 1 in 10 days reach 11 (very high)
August
1/1026–32°C (feels 37°C) · 27 rain days (266h) · 191 sun hours · 70% humidity · Busy crowd · UV 10 (very high) · sunniest 1 in 10 days reach 12 (extreme)
September
1/1025–31°C (feels 36°C) · 28 rain days (342h) · 172 sun hours · 74% humidity · Moderate crowd · UV 9 (very high) · sunniest 1 in 10 days reach 11 (extreme)
October
1/1024–31°C (feels 35°C) · 22 rain days (265h) · 193 sun hours · 71% humidity · Moderate crowd · UV 8 (high) · sunniest 1 in 10 days reach 9 (very high)
November
3/1024–31°C (feels 35°C) · 11 rain days (101h) · 220 sun hours · 61% humidity · Peak crowd · UV 7 (high) · sunniest 1 in 10 days reach 9 (very high)
Comparisons people search for
Pairs validated by Google Autocomplete demand — only pairs people actually compare.
Frequently asked questions about visiting Bangkok
When is the best time to visit Bangkok?
December is the highest-scoring month (5/10 on the Holiday Climate Index). Typical conditions: 22–31°C (4 rainy days). The top three months by score are December, January, February.
What is the worst time to visit Bangkok?
September is the lowest-scoring month (1/10, capped by extreme heat). Typical conditions: 25–31°C (28 rainy days).
Is Bangkok too hot in summer?
12 months (January, February, March, April, May, June, July, August, September, October, November, December) trip the heat deal-breaker in our scoring: apparent temperature crosses the comfort cap, so even with clear skies and low rain the score is held down. Plan around it if heat tolerance is low.
When are crowds lowest in Bangkok?
Search-interest seasonality (Google Trends 2021-2025) is lowest in May and peaks in November. Interest tracks both in-trip visitors and lead-time planners, so treat it as a "destination is on people's minds" signal rather than literal arrivals.
What is the UV index in Bangkok by month?
UV peaks at 10 (very high) in August and is lowest in November at 7 (high). Monthly peak values: Jan 8, Feb 9, Mar 10, Apr 10, May 9, Jun 9, Jul 9, Aug 10, Sep 9, Oct 8, Nov 7, Dec 7. February, March, April, May, June, July, August, September reach very high or extreme levels — apply SPF 50+, wear a hat and protective clothing, and limit direct sun between 11:00 and 17:00.
What is the UV index in Bangkok in August?
August is the peak UV month in Bangkok, with a daily-peak UV index of 10 (very high). At this level, sunburn can occur in under 20 minutes on unprotected fair skin. Apply SPF 50+, wear protective clothing and a hat, and avoid direct midday sun (11:00–17:00).
How high can UV get in Bangkok on the sunniest days?
Most days look like the monthly average, but on the sunniest ~1 in 10 days UV climbs higher than the mean suggests. August is the worst case: typical days average UV 10 (very high), but the top 10% of days reach UV 12 (extreme) — and even higher. Months where the sunniest days routinely exceed the typical reading: January, February, March, April, May, June, July, August, September, October, November, December. Plan sun protection for the worst case, not the average.
Is air quality in Bangkok bad for travelers?
PM2.5 (fine-particle pollution) exceeds the WHO sensitive-group guideline (15 µg/m³) in 12 months: January, February, March, April, May, June, July, August, September, October, November, December. The worst month is January with a typical-day mean of 49 µg/m³ (hazardous); on the worst 10% of days PM2.5 reaches 90 µg/m³ (hazardous) and higher. People with asthma, heart conditions, or sensitive children may want to avoid these months or limit outdoor activity. Source: CAMS via Open-Meteo.