January 1/10
feels -3°C
(−1°C vs 1991-2020) · HCI 10/100
Day 4° · Night -1°
72% humidity 37 km/h wind 20 rain days (357h) 38h sun
Thermal 0
Sky 0
Rain 1
Wind 7
Higher = better, including rain & wind (green = "doesn't hurt the score", not "lots of it").
February 1/10
feels -3°C
· HCI 10/100
Day 3° · Night -1°
77% humidity 36 km/h wind 20 rain days (349h) 60h sun
Thermal 0
Sky 0
Rain 1
Wind 7
Higher = better, including rain & wind (green = "doesn't hurt the score", not "lots of it").
March 1/10
feels -2°C
· HCI 11/100
Day 4° · Night 0°
72% humidity 33 km/h wind 21 rain days (344h) 130h sun
Thermal 0
Sky 0
Rain 1
Wind 8
Higher = better, including rain & wind (green = "doesn't hurt the score", not "lots of it").
April 1/10
feels 2°C
(+2°C vs 1991-2020) · HCI 15/100
Day 6° · Night 2°
76% humidity 26 km/h wind 18 rain days (308h) 164h sun
Thermal 0
Sky 1
Rain 1
Wind 9
Higher = better, including rain & wind (green = "doesn't hurt the score", not "lots of it").
May 1/10
feels 4°C
· HCI 14/100
Day 9° · Night 5°
76% humidity 28 km/h wind 22 rain days (367h) 193h sun
Thermal 1
Sky 0
Rain 1
Wind 9
Higher = better, including rain & wind (green = "doesn't hurt the score", not "lots of it").
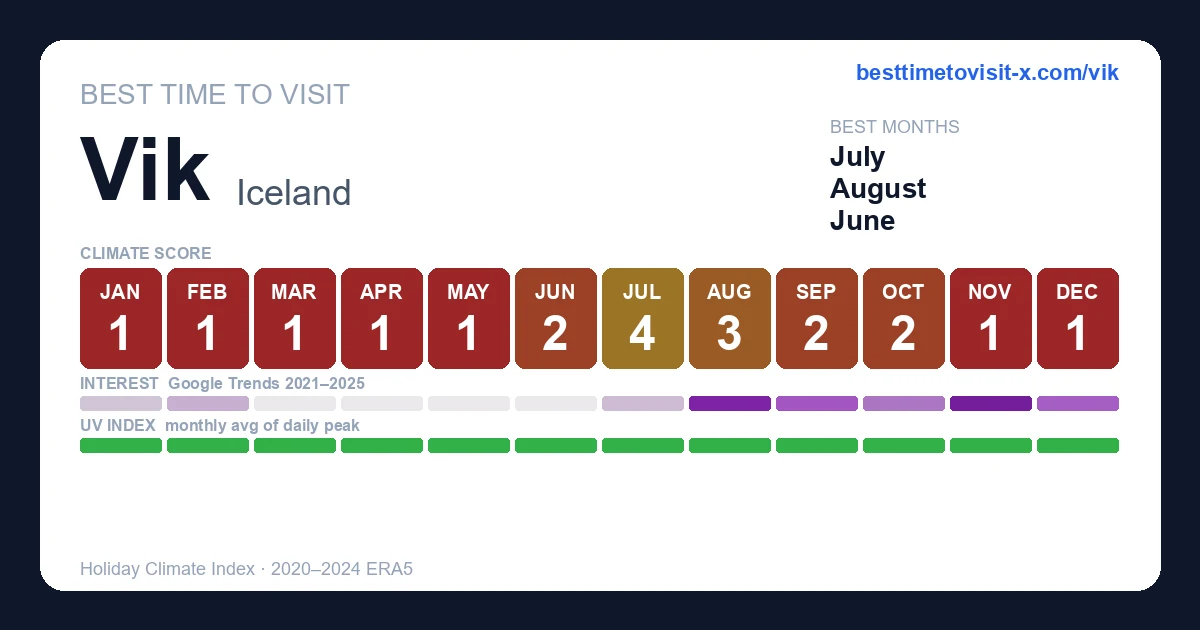
June 2/10
feels 8°C
(+1°C vs 1991-2020) · HCI 23/100
Day 12° · Night 8°
78% humidity 26 km/h wind 19 rain days (313h) 218h sun
Thermal 2
Sky 1
Rain 1
Wind 9
Higher = better, including rain & wind (green = "doesn't hurt the score", not "lots of it").
July 4/10
feels 11°C
(+2°C vs 1991-2020) · HCI 35/100
Day 14° · Night 9°
79% humidity 23 km/h wind 17 rain days (261h) 239h sun
Thermal 3
Sky 3
Rain 2
Wind 9
Higher = better, including rain & wind (green = "doesn't hurt the score", not "lots of it").
August 3/10
feels 11°C
(+2°C vs 1991-2020) · HCI 29/100
Day 13° · Night 9°
80% humidity 23 km/h wind 18 rain days (301h) 189h sun
Thermal 3
Sky 1
Rain 1
Wind 9
Higher = better, including rain & wind (green = "doesn't hurt the score", not "lots of it").
September 2/10
feels 7°C
(+1°C vs 1991-2020) · HCI 20/100
Day 11° · Night 7°
78% humidity 27 km/h wind 20 rain days (334h) 133h sun
Thermal 2
Sky 0
Rain 1
Wind 9
Higher = better, including rain & wind (green = "doesn't hurt the score", not "lots of it").
October 2/10
feels 3°C
(+1°C vs 1991-2020) · HCI 17/100
Day 8° · Night 4°
79% humidity 30 km/h wind 19 rain days (293h) 84h sun
Thermal 0
Sky 1
Rain 1
Wind 9
Higher = better, including rain & wind (green = "doesn't hurt the score", not "lots of it").
November 1/10
feels 0°C
(+1°C vs 1991-2020) · HCI 13/100
Day 6° · Night 2°
76% humidity 34 km/h wind 18 rain days (314h) 44h sun
Thermal 0
Sky 1
Rain 1
Wind 8
Higher = better, including rain & wind (green = "doesn't hurt the score", not "lots of it").
December 1/10
feels -3°C
(−1°C vs 1991-2020) · HCI 14/100
Day 3° · Night -1°
71% humidity 33 km/h wind 18 rain days (304h) 28h sun
Thermal 0
Sky 1
Rain 1
Wind 8
Higher = better, including rain & wind (green = "doesn't hurt the score", not "lots of it").
January 1–10 1/10
feels -2°C
· HCI 12/100
Day 4° · Night -1°
74% humidity 35 km/h wind 6 rain days (118h) 7h sun
Thermal 0
Sky 0
Rain 1
Wind 8
Higher = better, including rain & wind (green = "doesn't hurt the score", not "lots of it").
January 11–20 1/10
feels -3°C
· HCI 13/100
Day 3° · Night -1°
70% humidity 36 km/h wind 6 rain days (103h) 14h sun
Thermal 0
Sky 1
Rain 1
Wind 7
Higher = better, including rain & wind (green = "doesn't hurt the score", not "lots of it").
January 21–31 1/10
feels -3°C
(−1°C vs 1991-2020) · HCI 6/100
Day 3° · Night -1°
72% humidity 41 km/h wind 8 rain days (137h) 17h sun
Thermal 0
Sky 0
Rain 0
Wind 6
Higher = better, including rain & wind (green = "doesn't hurt the score", not "lots of it").
February 1–10 1/10
feels -4°C
(−1°C vs 1991-2020) · HCI 9/100
Day 2° · Night -2°
75% humidity 36 km/h wind 7 rain days (127h) 16h sun
Thermal 0
Sky 0
Rain 1
Wind 7
Higher = better, including rain & wind (green = "doesn't hurt the score", not "lots of it").
February 11–20 1/10
feels -3°C
(−1°C vs 1991-2020) · HCI 10/100
Day 4° · Night -1°
78% humidity 36 km/h wind 7 rain days (119h) 21h sun
Thermal 0
Sky 0
Rain 1
Wind 7
Higher = better, including rain & wind (green = "doesn't hurt the score", not "lots of it").
February 21–28 1/10
feels -2°C
(+1°C vs 1991-2020) · HCI 13/100
Day 4° · Night 0°
78% humidity 37 km/h wind 6 rain days (103h) 22h sun
Thermal 0
Sky 1
Rain 1
Wind 7
Higher = better, including rain & wind (green = "doesn't hurt the score", not "lots of it").
March 1–10 1/10
feels -2°C
(+1°C vs 1991-2020) · HCI 13/100
Day 4° · Night 0°
74% humidity 32 km/h wind 7 rain days (102h) 38h sun
Thermal 0
Sky 1
Rain 1
Wind 8
Higher = better, including rain & wind (green = "doesn't hurt the score", not "lots of it").
March 11–20 1/10
feels -2°C
· HCI 11/100
Day 4° · Night -1°
71% humidity 32 km/h wind 7 rain days (123h) 39h sun
Thermal 0
Sky 0
Rain 1
Wind 9
Higher = better, including rain & wind (green = "doesn't hurt the score", not "lots of it").
March 21–31 1/10
feels -2°C
(−1°C vs 1991-2020) · HCI 10/100
Day 4° · Night 0°
72% humidity 34 km/h wind 7 rain days (119h) 53h sun
Thermal 0
Sky 0
Rain 1
Wind 8
Higher = better, including rain & wind (green = "doesn't hurt the score", not "lots of it").
April 1–10 2/10
feels -1°C
· HCI 17/100
Day 4° · Night 0°
69% humidity 31 km/h wind 5 rain days (98h) 52h sun
Thermal 0
Sky 1
Rain 2
Wind 9
Higher = better, including rain & wind (green = "doesn't hurt the score", not "lots of it").
April 11–20 1/10
feels 2°C
(+2°C vs 1991-2020) · HCI 10/100
Day 7° · Night 3°
84% humidity 28 km/h wind 8 rain days (146h) 41h sun
Thermal 0
Sky 0
Rain 0
Wind 9
Higher = better, including rain & wind (green = "doesn't hurt the score", not "lots of it").
April 21–30 4/10
feels 4°C
(+3°C vs 1991-2020) · HCI 37/100
Day 8° · Night 4°
75% humidity 20 km/h wind 5 rain days (64h) 70h sun
Thermal 1
Sky 5
Rain 4
Wind 10
Higher = better, including rain & wind (green = "doesn't hurt the score", not "lots of it").
May 1–10 2/10
feels 3°C
· HCI 20/100
Day 7° · Night 3°
73% humidity 25 km/h wind 6 rain days (93h) 67h sun
Thermal 0
Sky 2
Rain 2
Wind 9
Higher = better, including rain & wind (green = "doesn't hurt the score", not "lots of it").
May 11–20 1/10
feels 4°C
(+1°C vs 1991-2020) · HCI 12/100
Day 8° · Night 4°
77% humidity 29 km/h wind 8 rain days (130h) 52h sun
Thermal 1
Sky 0
Rain 0
Wind 9
Higher = better, including rain & wind (green = "doesn't hurt the score", not "lots of it").
May 21–31 2/10
feels 6°C
(+1°C vs 1991-2020) · HCI 15/100
Day 10° · Night 6°
78% humidity 29 km/h wind 8 rain days (144h) 74h sun
Thermal 1
Sky 0
Rain 0
Wind 9
Higher = better, including rain & wind (green = "doesn't hurt the score", not "lots of it").
June 1–10 3/10
feels 7°C
(+1°C vs 1991-2020) · HCI 28/100
Day 11° · Night 7°
75% humidity 27 km/h wind 5 rain days (94h) 79h sun
Thermal 2
Sky 2
Rain 2
Wind 9
Higher = better, including rain & wind (green = "doesn't hurt the score", not "lots of it").
June 11–20 3/10
feels 8°C
(+1°C vs 1991-2020) · HCI 27/100
Day 12° · Night 8°
78% humidity 26 km/h wind 6 rain days (96h) 73h sun
Thermal 2
Sky 2
Rain 2
Wind 9
Higher = better, including rain & wind (green = "doesn't hurt the score", not "lots of it").
June 21–30 2/10
feels 9°C
(+1°C vs 1991-2020) · HCI 20/100
Day 12° · Night 8°
80% humidity 27 km/h wind 8 rain days (122h) 65h sun
Thermal 3
Sky 0
Rain 0
Wind 9
Higher = better, including rain & wind (green = "doesn't hurt the score", not "lots of it").
July 1–10 5/10
feels 11°C
(+2°C vs 1991-2020) · HCI 50/100
Day 14° · Night 9°
77% humidity 24 km/h wind 4 rain days (60h) 91h sun
Thermal 3
Sky 6
Rain 5
Wind 9
Higher = better, including rain & wind (green = "doesn't hurt the score", not "lots of it").
July 11–20 3/10
feels 11°C
(+2°C vs 1991-2020) · HCI 31/100
Day 14° · Night 9°
79% humidity 24 km/h wind 6 rain days (96h) 76h sun
Thermal 3
Sky 2
Rain 2
Wind 9
Higher = better, including rain & wind (green = "doesn't hurt the score", not "lots of it").
July 21–31 3/10
feels 11°C
(+1°C vs 1991-2020) · HCI 28/100
Day 13° · Night 10°
80% humidity 22 km/h wind 6 rain days (105h) 72h sun
Thermal 3
Sky 1
Rain 1
Wind 9
Higher = better, including rain & wind (green = "doesn't hurt the score", not "lots of it").
August 1–10 3/10
feels 11°C
(+1°C vs 1991-2020) · HCI 26/100
Day 13° · Night 10°
81% humidity 24 km/h wind 6 rain days (110h) 67h sun
Thermal 3
Sky 0
Rain 1
Wind 9
Higher = better, including rain & wind (green = "doesn't hurt the score", not "lots of it").
August 11–20 4/10
feels 11°C
(+1°C vs 1991-2020) · HCI 41/100
Day 14° · Night 9°
79% humidity 24 km/h wind 5 rain days (77h) 63h sun
Thermal 3
Sky 4
Rain 3
Wind 9
Higher = better, including rain & wind (green = "doesn't hurt the score", not "lots of it").
August 21–31 3/10
feels 11°C
(+2°C vs 1991-2020) · HCI 25/100
Day 13° · Night 9°
80% humidity 22 km/h wind 7 rain days (114h) 58h sun
Thermal 3
Sky 0
Rain 1
Wind 10
Higher = better, including rain & wind (green = "doesn't hurt the score", not "lots of it").
September 1–10 2/10
feels 9°C
(+2°C vs 1991-2020) · HCI 22/100
Day 12° · Night 9°
79% humidity 26 km/h wind 7 rain days (113h) 52h sun
Thermal 3
Sky 0
Rain 1
Wind 9
Higher = better, including rain & wind (green = "doesn't hurt the score", not "lots of it").
September 11–20 2/10
feels 7°C
(+1°C vs 1991-2020) · HCI 21/100
Day 11° · Night 7°
78% humidity 27 km/h wind 7 rain days (106h) 46h sun
Thermal 2
Sky 0
Rain 1
Wind 9
Higher = better, including rain & wind (green = "doesn't hurt the score", not "lots of it").
September 21–30 2/10
feels 5°C
· HCI 16/100
Day 9° · Night 5°
77% humidity 28 km/h wind 7 rain days (115h) 36h sun
Thermal 1
Sky 0
Rain 1
Wind 9
Higher = better, including rain & wind (green = "doesn't hurt the score", not "lots of it").
October 1–10 3/10
feels 4°C
(+1°C vs 1991-2020) · HCI 26/100
Day 9° · Night 4°
75% humidity 27 km/h wind 5 rain days (87h) 36h sun
Thermal 1
Sky 3
Rain 3
Wind 9
Higher = better, including rain & wind (green = "doesn't hurt the score", not "lots of it").
October 11–20 2/10
feels 3°C
(+1°C vs 1991-2020) · HCI 19/100
Day 7° · Night 4°
79% humidity 30 km/h wind 6 rain days (94h) 28h sun
Thermal 0
Sky 2
Rain 2
Wind 9
Higher = better, including rain & wind (green = "doesn't hurt the score", not "lots of it").
October 21–31 1/10
feels 2°C
(+1°C vs 1991-2020) · HCI 11/100
Day 7° · Night 4°
82% humidity 33 km/h wind 7 rain days (112h) 19h sun
Thermal 0
Sky 0
Rain 1
Wind 8
Higher = better, including rain & wind (green = "doesn't hurt the score", not "lots of it").
November 1–10 2/10
feels 2°C
(+2°C vs 1991-2020) · HCI 16/100
Day 7° · Night 3°
77% humidity 34 km/h wind 6 rain days (95h) 19h sun
Thermal 0
Sky 2
Rain 2
Wind 8
Higher = better, including rain & wind (green = "doesn't hurt the score", not "lots of it").
November 11–20 1/10
feels 0°C
(+1°C vs 1991-2020) · HCI 10/100
Day 5° · Night 2°
77% humidity 36 km/h wind 7 rain days (118h) 15h sun
Thermal 0
Sky 0
Rain 1
Wind 7
Higher = better, including rain & wind (green = "doesn't hurt the score", not "lots of it").
November 21–30 1/10
feels -1°C
· HCI 14/100
Day 4° · Night 0°
74% humidity 33 km/h wind 6 rain days (101h) 9h sun
Thermal 0
Sky 1
Rain 1
Wind 8
Higher = better, including rain & wind (green = "doesn't hurt the score", not "lots of it").
December 1–10 2/10
feels -3°C
(−1°C vs 1991-2020) · HCI 23/100
Day 3° · Night -1°
70% humidity 31 km/h wind 5 rain days (75h) 14h sun
Thermal 0
Sky 2
Rain 4
Wind 9
Higher = better, including rain & wind (green = "doesn't hurt the score", not "lots of it").
December 11–20 1/10
feels -2°C
· HCI 8/100
Day 4° · Night 1°
77% humidity 35 km/h wind 8 rain days (142h) 4h sun
Thermal 0
Sky 0
Rain 0
Wind 8
Higher = better, including rain & wind (green = "doesn't hurt the score", not "lots of it").
December 21–31 2/10
feels -5°C
(−2°C vs 1991-2020) · HCI 16/100
Day 1° · Night -3°
67% humidity 33 km/h wind 6 rain days (87h) 10h sun
Thermal 0
Sky 1
Rain 2
Wind 8
Higher = better, including rain & wind (green = "doesn't hurt the score", not "lots of it").
 Private Ice Climbing on Sólheimajökull
 Sólheimajökull Blue Ice Cave & Glacier Walk
 Vestmannaeyjar, Puffins & Volcanoes Small Group Day Tour
 Þórsmörk Adventure w. Golden Circle - 3 days
 Sólheimajökull Glacier Hike - Small Group Blue Ice Adventure
 Quad Bike Tour on Black Lava Sands from Mýrdalur
 Sólheimajökull Glacier Hike – Adventure in a Small Group
 Lava Show Vik Admission Ticket
 Solheimajokull Glacier 3-Hour Small-Group Hike
 Private Glacier Hike on Sólheimajökull Glacier