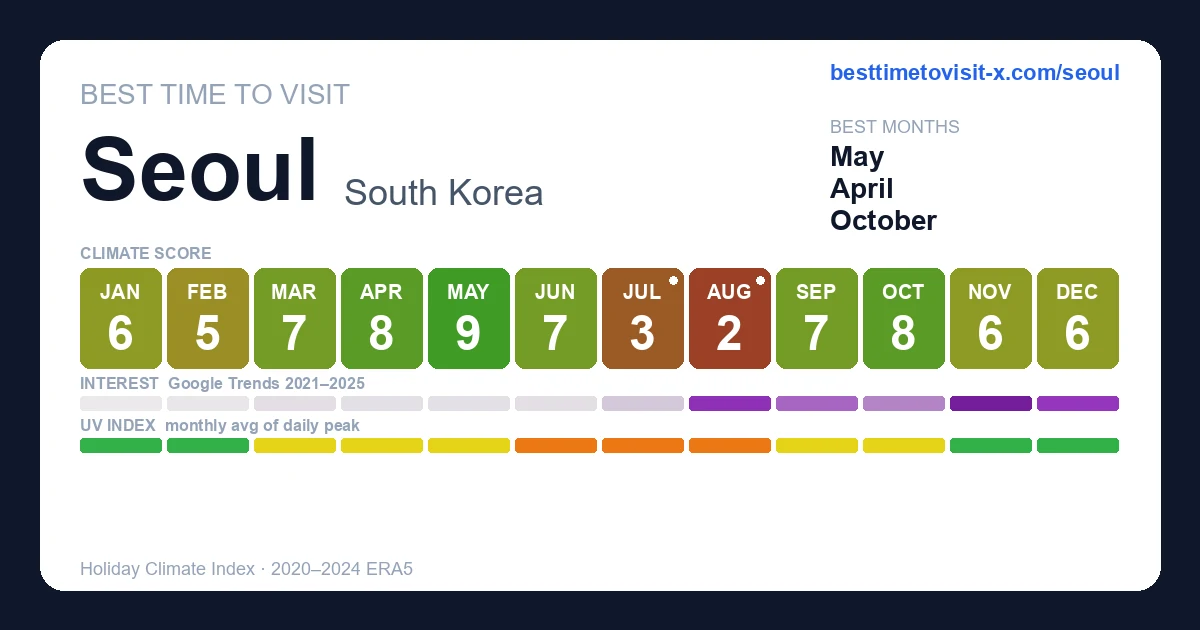
Best time to visit Seoul
Re-score for me — drag the dial — every chart on the page recolours live for your heat limit 27°C
Default 27 °C is the upper edge of the Holiday Climate Index "ideal comfort" band (Scott, Rutty, Amelung & Tang, 2016). Above this, most warm-tourism travellers report measurable discomfort.
Greyed factors are scored normally — extreme heat overrides them, so a clear sky or low rain can't lift the period.
Greyed factors are scored normally — extreme heat overrides them, so a clear sky or low rain can't lift the period.
Greyed factors are scored normally — extreme heat overrides them, so a clear sky or low rain can't lift the period.
Greyed factors are scored normally — extreme heat overrides them, so a clear sky or low rain can't lift the period.
Greyed factors are scored normally — extreme heat overrides them, so a clear sky or low rain can't lift the period.
Greyed factors are scored normally — extreme heat overrides them, so a clear sky or low rain can't lift the period.
Greyed factors are scored normally — extreme heat overrides them, so a clear sky or low rain can't lift the period.
Greyed factors are scored normally — extreme heat overrides them, so a clear sky or low rain can't lift the period.
Greyed factors are scored normally — extreme heat overrides them, so a clear sky or low rain can't lift the period.
Greyed factors are scored normally — extreme heat overrides them, so a clear sky or low rain can't lift the period.
Greyed factors are scored normally — extreme heat overrides them, so a clear sky or low rain can't lift the period.
Greyed factors are scored normally — extreme heat overrides them, so a clear sky or low rain can't lift the period.
Greyed factors are scored normally — extreme heat overrides them, so a clear sky or low rain can't lift the period.
Greyed factors are scored normally — extreme heat overrides them, so a clear sky or low rain can't lift the period.
Greyed factors are scored normally — extreme heat overrides them, so a clear sky or low rain can't lift the period.
Greyed factors are scored normally — extreme heat overrides them, so a clear sky or low rain can't lift the period.
How is this scored? HCI / Steadman / CCI gate — full methodology and citations below.
Compare with another destination
Add as many as you like — stacked below the main strips above. Each row is just the recent-window score strip and (for beach destinations) sea-temperature strip.
Tours in Seoul
30 top-rated tours via Viator. Booking links earn this site a commission at no cost to you. Map locations are approximate (centred on Seoul).
- 1
 Seoul Street Food Market Tour
 - 2
 Full-Day Tour in Mt. Seorak & Nami (+Rail Bike Option)
 - 3
 Mt. Seorak+Nami Island+Garden of Morning Calm Day Trip from Seoul
 - 4
 Signature DMZ Tour: Exclusive NK Defector Talk +Suspension Bridge
 - 5
 Half-Day DMZ Tour Led by a Retired Military Officer from Seoul
 - 6
 Private DMZ Insider Tour: Meet a NK Defector, 3rd Tunnel & Bridge
 - 7
 Seoul City Private Full-Day Tour Including Lunch
 - 8
 Day Trip to Nami Island with Rail bike and The Garden of Morning Calm
 - 9
 Private DMZ the 3rd Tunnel Tour from Seoul (optional Red Bridge)
 - 10
 Royal Seoul Cooking Class in a 100-Year-Old Hanok
 - 11
 Nami Island, Alpaca World and Gangchon Rail Bike Tour from Seoul
 - 12
 SEOUL / SUBURB / AIRPORT / PRIVATE VAN [Eng Speaking Driver]KOREA
 - 13
 Official MBC Insider Live K-Drama Rehearsal & VIP Studio Tour
 - 14
 Nami Island, K-garden and Gangchon Rail Bike tour from Seoul
 - 15
 Exclusive JSA Museum Experience and DMZ Tour from Seoul
 - 16
 Private Tour DMZ Peace 3rd Invasion Tunnel and Suspension Bridge
 - 17
 Best DMZ Tour Korea from Seoul (Suspension Bridge & JSA Museum)
 - 18
 DMZ Insider Tour: 3rd Tunnel, NK Defector Meet& Suspension Bridge
 - 19
 Seoul City Sightseeing Tour Including Gyeongbokgung Palace, N Seoul Tower, and Namsangol Hanok Village
 - 20
 DMZ Tour: NK Defector Meet up, 3rd Tunnel & Suspension Bridge
 - 21
 Small Group DMZ Tour with Hotel pickup : 3rd tunnel&Susp. Bridge
 - 22
 Best Seoul City Tour (Gyeongbokgung Palace,Insadong,Namsan Tower)
 - 23
 Small-Group Full-Day Royal Palace & Seoul City Tour (Pick-up)
 - 24
 Seoul: Gyeongbok Palace, Hanok Village, and Gwangjang Tour
 - 25
 Downtown Seoul Guided Food & Market Tour with 8+ Local Tastings
 - 26
 DMZ Guided Tour with N.K./Gondola/Suspension Bridge from Seoul
 - 27
 Local Home Korean Cooking Class & Market Adventure in Seoul
 - 28
 DMZ tour from Seoul; North Korean Defector Meet up & 3rd Tunnel
 - 29
 Ultimate Korea DMZ Tour from Seoul (JSA Museum & Bridge Crossing)
 - 30
 Seoul E-bike Tour
Last refreshed 2026-05-30.
Similar climatesIncheon97% · Daegu93% · Busan93%
Other destinations with the most-alike year-round climate to Seoul (apparent temperature, rain hours, sunshine — matched within the same trip-profile). The ±N chip compares each match's typical score for the current month against Seoul's. Based on the 2020-2024 climatology, not this year's actual weather.
Month-by-month
| Month | Temp °C | Feels °C | Rain days | Rain h | Rain h/day | Humidity | Wind km/h | Sun h | UV | Interest | Score |
|---|---|---|---|---|---|---|---|---|---|---|---|
| Jan | -6–3 | -2 | 4 | 52 | 13.0 | 48% | 16 | 173 | 2 | Quiet | 6 |
| Feb | -4–6 | 1 | 5 | 53 | 10.6 | 50% | 18 | 169 | 3 | Quiet | 5 |
| Mar | 1–12 | 8 | 7 | 61 | 8.7 | 50% | 18 | 204 | 4 | Quiet | 7 |
| Apr | 7–18 | 15 | 6 | 59 | 9.8 | 46% | 20 | 208 | 5 | Quiet | 8 |
| May | 12–22 | 21 | 9 | 105 | 11.7 | 54% | 19 | 220 | 5 | Quiet | 9 |
| Jun | 18–27 | 28 | 12 | 143 | 11.9 | 61% | 18 | 207 | 6 | Quiet | 7 |
| Jul | 22–29 | 32 | 20 | 260 | 13.0 | 73% | 16 | 189 | 6 | Quiet | 3 |
| Aug | 23–29 | 33 | 19 | 257 | 13.5 | 74% | 16 | 198 | 6 | Busy | 2 |
| Sep | 18–26 | 27 | 11 | 150 | 13.6 | 67% | 15 | 191 | 5 | Moderate | 7 |
| Oct | 9–18 | 17 | 7 | 73 | 10.4 | 62% | 14 | 190 | 3 | Moderate | 8 |
| Nov | 2–12 | 9 | 7 | 71 | 10.1 | 59% | 15 | 167 | 2 | Peak | 6 |
| Dec | -6–3 | -2 | 3 | 43 | 14.3 | 52% | 16 | 171 | 2 | Busy | 6 |
UV Index in Seoul by Month
UV index in Seoul peaks at 6 (high) in June, dropping to 2 (low) in December. June, July, August have high UV — SPF 30+ and sunglasses recommended.
Best months in detail
May
9/1012–22°C (feels 21°C) · 9 rain days (105h) · 220 sun hours · 54% humidity · Quiet crowd · UV 5 (moderate) · sunniest 1 in 10 days reach 7 (high)
April
8/107–18°C (feels 15°C) · 6 rain days (59h) · 208 sun hours · 46% humidity · Quiet crowd · UV 5 (moderate) · sunniest 1 in 10 days reach 7 (high)
October
8/109–18°C (feels 17°C) · 7 rain days (73h) · 190 sun hours · 62% humidity · Moderate crowd · UV 3 (moderate) · sunniest 1 in 10 days reach 5 (moderate)
Every month
Show the other 9 months in detail
January
6/10-6–3°C (feels -2°C) · 4 rain days (52h) · 173 sun hours · 48% humidity · Quiet crowd · UV 2 (low)
February
5/10-4–6°C (feels 1°C) · 5 rain days (53h) · 169 sun hours · 50% humidity · Quiet crowd · UV 3 (low) · sunniest 1 in 10 days reach 4 (moderate)
March
7/101–12°C (feels 8°C) · 7 rain days (61h) · 204 sun hours · 50% humidity · Quiet crowd · UV 4 (moderate)
June
7/1018–27°C (feels 28°C) · 12 rain days (143h) · 207 sun hours · 61% humidity · Quiet crowd · UV 6 (high) · sunniest 1 in 10 days reach 8 (very high)
July
3/1022–29°C (feels 32°C) · 20 rain days (260h) · 189 sun hours · 73% humidity · Quiet crowd · UV 6 (high) · sunniest 1 in 10 days reach 9 (very high)
August
2/1023–29°C (feels 33°C) · 19 rain days (257h) · 198 sun hours · 74% humidity · Busy crowd · UV 6 (high) · sunniest 1 in 10 days reach 9 (very high)
September
7/1018–26°C (feels 27°C) · 11 rain days (150h) · 191 sun hours · 67% humidity · Moderate crowd · UV 5 (moderate) · sunniest 1 in 10 days reach 7 (high)
November
6/102–12°C (feels 9°C) · 7 rain days (71h) · 167 sun hours · 59% humidity · Peak crowd · UV 2 (low) · sunniest 1 in 10 days reach 3 (moderate)
December
6/10-6–3°C (feels -2°C) · 3 rain days (43h) · 171 sun hours · 52% humidity · Busy crowd · UV 2 (low)
Frequently asked questions about visiting Seoul
When is the best time to visit Seoul?
May is the highest-scoring month (9/10 on the Holiday Climate Index). Typical conditions: 12–22°C (9 rainy days). The top three months by score are May, April, October.
What is the worst time to visit Seoul?
August is the lowest-scoring month (2/10, capped by extreme heat). Typical conditions: 23–29°C (19 rainy days).
Is Seoul too hot in summer?
2 months (July, August) trip the heat deal-breaker in our scoring: apparent temperature crosses the comfort cap, so even with clear skies and low rain the score is held down. Plan around it if heat tolerance is low.
When are crowds lowest in Seoul?
Search-interest seasonality (Google Trends 2021-2025) is lowest in January and peaks in November. Interest tracks both in-trip visitors and lead-time planners, so treat it as a "destination is on people's minds" signal rather than literal arrivals.
Which months in Seoul have good weather but fewer tourists?
May (climate 9/10, crowd index 5) and April (climate 8/10, crowd index 5) — shoulder months with above-average climate and below-median search-interest. Often the best value-for-weather trade.
What is the UV index in Seoul by month?
UV peaks at 6 (high) in June and is lowest in December at 2 (low). Monthly peak values: Jan 2, Feb 3, Mar 4, Apr 5, May 5, Jun 6, Jul 6, Aug 6, Sep 5, Oct 3, Nov 2, Dec 2.
What is the UV index in Seoul in June?
June is the peak UV month in Seoul, with a daily-peak UV index of 6 (high). Apply SPF 30+, wear sunglasses, and seek shade during midday hours.
How high can UV get in Seoul on the sunniest days?
Most days look like the monthly average, but on the sunniest ~1 in 10 days UV climbs higher than the mean suggests. July is the worst case: typical days average UV 6 (high), but the top 10% of days reach UV 9 (very high) — and even higher. Months where the sunniest days routinely exceed the typical reading: February, April, May, June, July, August, September, October, November. Plan sun protection for the worst case, not the average.
Is air quality in Seoul bad for travelers?
PM2.5 (fine-particle pollution) exceeds the WHO sensitive-group guideline (15 µg/m³) in 12 months: January, February, March, April, May, June, July, August, September, October, November, December. The worst month is March with a typical-day mean of 37 µg/m³ (hazardous); on the worst 10% of days PM2.5 reaches 66 µg/m³ (hazardous) and higher. People with asthma, heart conditions, or sensitive children may want to avoid these months or limit outdoor activity. Source: CAMS via Open-Meteo.