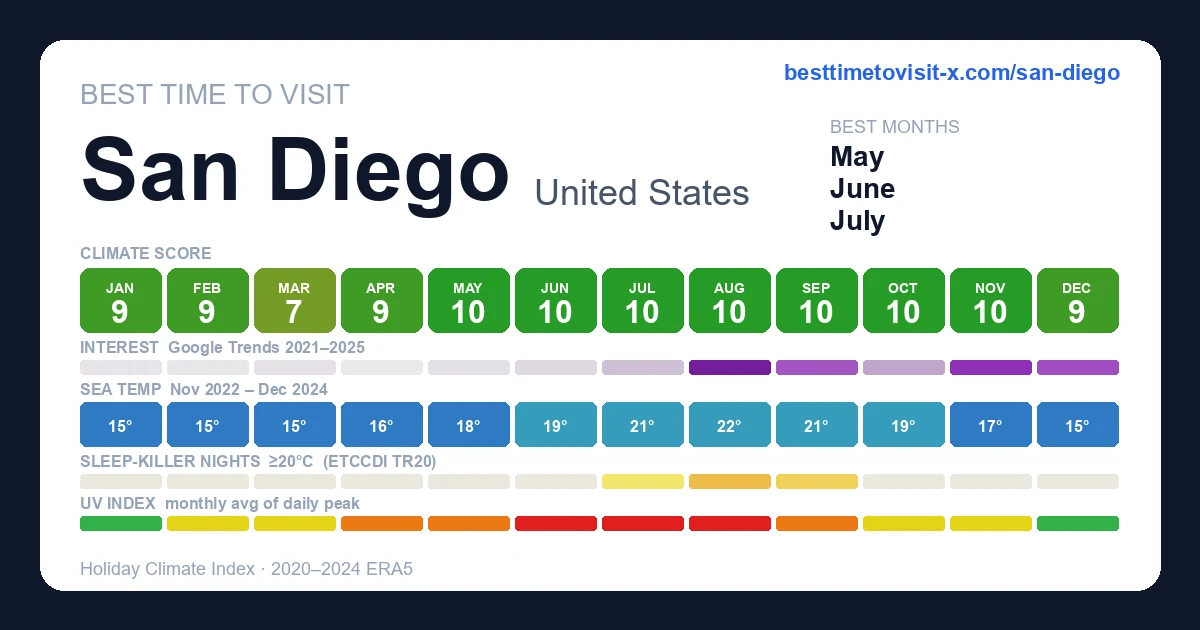
Best time to visit San Diego
Re-score for me — drag the dial — every chart recolours live for your heat & sea limits 27°C · sea 29°C
Default 27 °C is the upper edge of the Holiday Climate Index "ideal comfort" band (Scott, Rutty, Amelung & Tang, 2016). Above this, most warm-tourism travellers report measurable discomfort.
Default 29 °C is the Beach Climate Index "bathtub" line (Morgan et al.) — where the sea stops being refreshing and starts feeling like a warm bath.
How is this scored? HCI / Steadman / CCI gate — full methodology and citations below.
Compare with another destination
Add as many as you like — stacked below the main strips above. Each row is just the recent-window score strip and (for beach destinations) sea-temperature strip.
Tours in San Diego
28 top-rated tours via Viator. Booking links earn this site a commission at no cost to you.
- 1
 San Diego Whale Watching Cruise
 - 2
 Small-Group San Diego Afternoon Sailing Excursion
 - 3
 Sunset Sail Along the San Diego Skyline
 - 4
 Small-Group San Diego Sunset Sailing Excursion
 - 5
 San Diego Harbor Cruise on the Largest Catamaran in San Diego
 - 6
 Private Sailing Charter on San Diego Bay
 - 7
 Private Surf Lesson
 - 8
 Deluxe private Sunset & Day Sail
 - 9
 San Diego Whale Watching & Dolphin Cruise
 - 10
 Original La Jolla Sea Cave Kayak Tour for Two
 - 11
 USS Midway Museum Admission: Valid Any Date
 - 12
 Deluxe Sunset & Day Sail Small Group
 - 13
 Top Rated San Diego Sunset Sail Classic Yacht 6 Guests
 - 14
 Jet Ski Rental Adventure in San Diego Bay
 - 15
 Daytime Sailing Along San Diego's Skyline
 - 16
 Deluxe Day Sail in San Diego
 - 17
 San Diego Balboa Park Highlights Small Group Tour with Coffee
 - 18
 Sweet Treats of San Diego & Little Italy: Donuts, Pastries & More
 - 19
 2.5-Hour Small-Group Catamaran Sailing Adventure with Drinks
 - 20
 Downtown Food and Drink Tour: Libations on the East Side
 - 21
 San Diego Old Town Tales, Tacos and Tequila Small Group Tour
 - 22
 San Diego Sailing Sunset and Afternoon Classic Yacht
 - 23
 San Diego Harbor Speed Boat Adventure
 - 24
 Taste of Little Italy in San Diego
 - 25
 Gaslamp Quarter Food and Drink Tour: Brothels, Bites & Booze
 - 26
 San Diego Walking Food Tour and Ferry to Coronado Island
 - 27
 Chauffeured Adventure to Local San Diego Vineyards
 - 28
 Little Italy Food and Drink Walking Tour: Pizza, Pasta & Piazzas
Last refreshed 2026-05-25.
Similar climatesAlicante89% · Torremolinos89% · Benidorm89%
Other destinations with the most-alike year-round climate to San Diego (apparent temperature, rain hours, sunshine — matched within the same trip-profile). The ±N chip compares each match's typical score for the current month against San Diego's. Based on the 2020-2024 climatology, not this year's actual weather.
Month-by-month
| Month | Temp °C | Feels °C | Rain days | Rain h | Rain h/day | Humidity | Wind km/h | Sun h | UV | Interest | Score |
|---|---|---|---|---|---|---|---|---|---|---|---|
| Jan | 8–17 | 15 | 7 | 78 | 11.1 | 61% | 18 | 202 | 3 | Quiet | 9 |
| Feb | 8–18 | 15 | 6 | 75 | 12.5 | 56% | 20 | 194 | 4 | Quiet | 9 |
| Mar | 10–17 | 15 | 10 | 138 | 13.8 | 64% | 21 | 230 | 6 | Quiet | 7 |
| Apr | 12–19 | 17 | 3 | 60 | 20.0 | 62% | 20 | 237 | 7 | Quiet | 9 |
| May | 14–20 | 19 | 1 | 28 | 28.0 | 62% | 19 | 256 | 8 | Quiet | 10 |
| Jun | 16–22 | 21 | 1 | 17 | 17.0 | 62% | 19 | 264 | 9 | Quiet | 10 |
| Jul | 18–24 | 24 | 0 | 3 | — | 64% | 18 | 284 | 10 | Quiet | 10 |
| Aug | 19–26 | 26 | 1 | 12 | 12.0 | 64% | 19 | 268 | 10 | Peak | 10 |
| Sep | 18–26 | 26 | 1 | 22 | 22.0 | 62% | 19 | 237 | 7 | Busy | 10 |
| Oct | 15–24 | 23 | 2 | 25 | 12.5 | 57% | 18 | 225 | 6 | Quiet | 10 |
| Nov | 11–21 | 19 | 3 | 30 | 10.0 | 49% | 17 | 212 | 4 | Busy | 10 |
| Dec | 9–18 | 16 | 5 | 59 | 11.8 | 58% | 16 | 189 | 3 | Busy | 9 |
UV Index in San Diego by Month
UV index in San Diego peaks at 10 (very high) in July, dropping to 3 (low) in December. June, July, August reach very high or extreme levels — apply SPF 50+, wear a hat and protective clothing, and limit direct sun between 11:00 and 17:00.
Best months in detail
November
10/1011–21°C (feels 19°C) · 3 rain days (30h) · 212 sun hours · 49% humidity · Busy crowd · UV 4 (moderate)
October
10/1015–24°C · 2 rain days (25h) · 225 sun hours · 57% humidity · Quiet crowd · UV 6 (moderate) · sunniest 1 in 10 days reach 7 (high)
June
10/1016–22°C · 1 rain days (17h) · 264 sun hours · 62% humidity · Quiet crowd · UV 9 (very high) · sunniest 1 in 10 days reach 11 (very high)
Every month
Show the other 9 months in detail
January
9/108–17°C (feels 15°C) · 7 rain days (78h) · 202 sun hours · 61% humidity · Quiet crowd · UV 3 (low) · sunniest 1 in 10 days reach 4 (moderate)
February
9/108–18°C (feels 15°C) · 6 rain days (75h) · 194 sun hours · 56% humidity · Quiet crowd · UV 4 (moderate) · sunniest 1 in 10 days reach 6 (moderate)
March
7/1010–17°C (feels 15°C) · 10 rain days (138h) · 230 sun hours · 64% humidity · Quiet crowd · UV 6 (moderate) · sunniest 1 in 10 days reach 8 (high)
April
9/1012–19°C (feels 17°C) · 3 rain days (60h) · 237 sun hours · 62% humidity · Quiet crowd · UV 7 (high) · sunniest 1 in 10 days reach 9 (very high)
May
10/1014–20°C (feels 19°C) · 1 rain days (28h) · 256 sun hours · 62% humidity · Quiet crowd · UV 8 (high) · sunniest 1 in 10 days reach 9 (very high)
July
10/1018–24°C · 0 rain days (3h) · 284 sun hours · 64% humidity · Quiet crowd · UV 10 (very high) · sunniest 1 in 10 days reach 11 (extreme)
August
10/1019–26°C · 1 rain days (12h) · 268 sun hours · 64% humidity · Peak crowd · UV 10 (very high)
September
10/1018–26°C · 1 rain days (22h) · 237 sun hours · 62% humidity · Busy crowd · UV 7 (high) · sunniest 1 in 10 days reach 9 (very high)
December
9/109–18°C (feels 16°C) · 5 rain days (59h) · 189 sun hours · 58% humidity · Busy crowd · UV 3 (low) · sunniest 1 in 10 days reach 3 (moderate)
Comparisons people search for
Pairs validated by Google Autocomplete demand — only pairs people actually compare.
Frequently asked questions about visiting San Diego
When is the best time to visit San Diego?
November is the highest-scoring month (10/10 on the Holiday Climate Index). Typical conditions: 11–21°C (3 rainy days). The top three months by score are November, October, June.
What is the worst time to visit San Diego?
March is the lowest-scoring month (7/10). Typical conditions: 10–17°C (10 rainy days).
When are crowds lowest in San Diego?
Search-interest seasonality (Google Trends 2021-2025) is lowest in April and peaks in August. Interest tracks both in-trip visitors and lead-time planners, so treat it as a "destination is on people's minds" signal rather than literal arrivals.
Which months in San Diego have good weather but fewer tourists?
May (climate 10/10, crowd index 5) and June (climate 10/10, crowd index 10) — shoulder months with above-average climate and below-median search-interest. Often the best value-for-weather trade.
What is the UV index in San Diego by month?
UV peaks at 10 (very high) in July and is lowest in December at 3 (low). Monthly peak values: Jan 3, Feb 4, Mar 6, Apr 7, May 8, Jun 9, Jul 10, Aug 10, Sep 7, Oct 6, Nov 4, Dec 3. June, July, August reach very high or extreme levels — apply SPF 50+, wear a hat and protective clothing, and limit direct sun between 11:00 and 17:00.
What is the UV index in San Diego in July?
July is the peak UV month in San Diego, with a daily-peak UV index of 10 (very high). At this level, sunburn can occur in under 20 minutes on unprotected fair skin. Apply SPF 50+, wear protective clothing and a hat, and avoid direct midday sun (11:00–17:00).
How high can UV get in San Diego on the sunniest days?
Most days look like the monthly average, but on the sunniest ~1 in 10 days UV climbs higher than the mean suggests. July is the worst case: typical days average UV 10 (very high), but the top 10% of days reach UV 11 (extreme) — and even higher. Months where the sunniest days routinely exceed the typical reading: January, February, March, April, May, June, July, September, October, December. Plan sun protection for the worst case, not the average.
Is air quality in San Diego bad for travelers?
PM2.5 (fine-particle pollution) exceeds the WHO sensitive-group guideline (15 µg/m³) in 12 months: January, February, March, April, May, June, July, August, September, October, November, December. The worst month is December with a typical-day mean of 21 µg/m³ (unhealthy for sensitive); on the worst 10% of days PM2.5 reaches 34 µg/m³ (unhealthy) and higher. People with asthma, heart conditions, or sensitive children may want to avoid these months or limit outdoor activity. Source: CAMS via Open-Meteo.