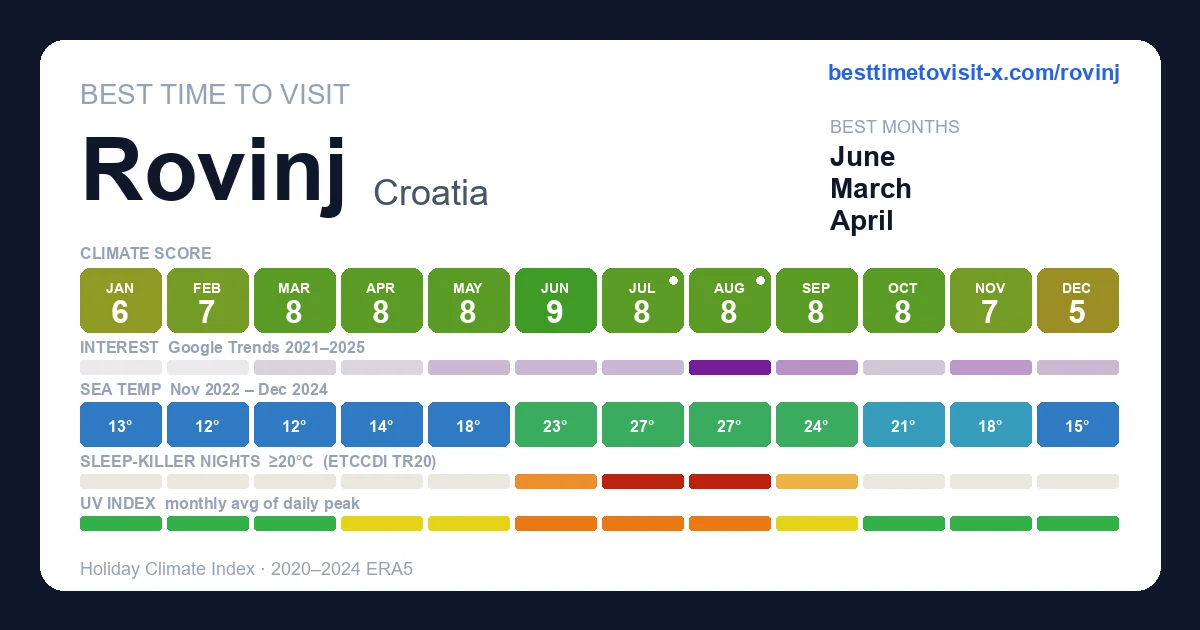
January 6/10 beach 5/10 urban
feels 7°C
(+1°C vs 1991-2020) · HCI 63/100
Day 10° · Night 5°
71% humidity 19 km/h wind 9 rain days (117h) 143h sun
sea 13°C
Thermal 2
Sky 7
Rain 7
Wind 10
Higher = better, including rain & wind (green = "doesn't hurt the score", not "lots of it").
February 7/10 beach 6/10 urban
feels 9°C
(+3°C vs 1991-2020) · HCI 71/100
Day 12° · Night 6°
69% humidity 19 km/h wind 8 rain days (85h) 162h sun
sea 12°C
Thermal 3
Sky 8
Rain 8
Wind 10
Higher = better, including rain & wind (green = "doesn't hurt the score", not "lots of it").
March 8/10 beach 7/10 urban
feels 10°C
· HCI 79/100
Day 14° · Night 7°
59% humidity 21 km/h wind 8 rain days (89h) 217h sun
sea 13°C
Thermal 4
Sky 9
Rain 8
Wind 10
Higher = better, including rain & wind (green = "doesn't hurt the score", not "lots of it").
April 8/10 beach 8/10 urban
feels 14°C
· HCI 83/100
Day 17° · Night 10°
56% humidity 20 km/h wind 9 rain days (88h) 237h sun
sea 14°C
Thermal 6
Sky 9
Rain 8
Wind 10
Higher = better, including rain & wind (green = "doesn't hurt the score", not "lots of it").
May 8/10 beach 8/10 urban
feels 20°C
· HCI 77/100
Day 21° · Night 15°
60% humidity 20 km/h wind 12 rain days (129h) 270h sun
sea 18°C
Thermal 9
Sky 8
Rain 6
Wind 10
Higher = better, including rain & wind (green = "doesn't hurt the score", not "lots of it").
June 9/10 beach 9/10 urban
feels 27°C
(+2°C vs 1991-2020) · HCI 91/100
Day 26° · Night 20°
🌙 14 tropical nights/yr
· peak 22 58% humidity 17 km/h wind 9 rain days (78h) 295h sun
sea 23°C
Thermal 9
Sky 10
Rain 8
Wind 10
Higher = better, including rain & wind (green = "doesn't hurt the score", not "lots of it").
July 8/10 beach 7/10 urban
feels 30°C
(+1°C vs 1991-2020) · extreme heat caps 91 → 79/100
Day 30° · Night 22°
· cools 8° at night
🌙 26 tropical nights/yr
· peak 30 50% humidity 18 km/h wind 7 rain days (51h) 311h sun
sea 27°C
Thermal 7
Sky 10
Rain 9
Wind 10
Higher = better, including rain & wind (green = "doesn't hurt the score", not "lots of it").
Greyed factors are scored normally — extreme heat overrides them, so a clear sky or low rain can't lift the period.
August 8/10 beach 7/10 urban
feels 30°C
(+1°C vs 1991-2020) · extreme heat caps 90 → 78/100
Day 29° · Night 22°
🌙 27 tropical nights/yr
· peak 31 52% humidity 18 km/h wind 6 rain days (60h) 286h sun
sea 27°C
Thermal 7
Sky 10
Rain 9
Wind 10
Higher = better, including rain & wind (green = "doesn't hurt the score", not "lots of it").
Greyed factors are scored normally — extreme heat overrides them, so a clear sky or low rain can't lift the period.
September 8/10 beach 9/10 urban
feels 24°C
(+1°C vs 1991-2020) · HCI 85/100
Day 25° · Night 18°
🌙 9 tropical nights/yr
· peak 15 58% humidity 20 km/h wind 10 rain days (102h) 230h sun
sea 25°C
Thermal 9
Sky 9
Rain 7
Wind 10
Higher = better, including rain & wind (green = "doesn't hurt the score", not "lots of it").
October 8/10 beach 8/10 urban
feels 19°C
(+2°C vs 1991-2020) · HCI 77/100
Day 20° · Night 15°
68% humidity 19 km/h wind 10 rain days (124h) 193h sun
sea 21°C
Thermal 8
Sky 8
Rain 7
Wind 10
Higher = better, including rain & wind (green = "doesn't hurt the score", not "lots of it").
November 7/10 beach 6/10 urban
feels 13°C
(+1°C vs 1991-2020) · HCI 66/100
Day 15° · Night 10°
69% humidity 20 km/h wind 10 rain days (127h) 142h sun
sea 18°C
Thermal 5
Sky 7
Rain 7
Wind 10
Higher = better, including rain & wind (green = "doesn't hurt the score", not "lots of it").
December 5/10 beach 5/10 urban
feels 9°C
(+2°C vs 1991-2020) · HCI 51/100
Day 12° · Night 7°
74% humidity 19 km/h wind 14 rain days (185h) 114h sun
sea 15°C
Thermal 3
Sky 5
Rain 5
Wind 10
Higher = better, including rain & wind (green = "doesn't hurt the score", not "lots of it").
January 1–10 5/10 beach 5/10 urban
feels 8°C
(+2°C vs 1991-2020) · HCI 51/100
Day 11° · Night 6°
75% humidity 19 km/h wind 4 rain days (56h) 36h sun
sea 14°C
Thermal 2
Sky 5
Rain 5
Wind 10
Higher = better, including rain & wind (green = "doesn't hurt the score", not "lots of it").
January 11–20 7/10 beach 6/10 urban
feels 7°C
(+1°C vs 1991-2020) · HCI 68/100
Day 10° · Night 4°
68% humidity 19 km/h wind 2 rain days (28h) 50h sun
sea 14°C
Thermal 2
Sky 7
Rain 8
Wind 10
Higher = better, including rain & wind (green = "doesn't hurt the score", not "lots of it").
January 21–31 7/10 beach 6/10 urban
feels 7°C
(+2°C vs 1991-2020) · HCI 69/100
Day 10° · Night 4°
70% humidity 18 km/h wind 3 rain days (33h) 56h sun
sea 13°C
Thermal 2
Sky 8
Rain 8
Wind 10
Higher = better, including rain & wind (green = "doesn't hurt the score", not "lots of it").
February 1–10 7/10 beach 6/10 urban
feels 8°C
(+2°C vs 1991-2020) · HCI 68/100
Day 11° · Night 6°
72% humidity 19 km/h wind 2 rain days (36h) 51h sun
sea 12°C
Thermal 3
Sky 7
Rain 8
Wind 10
Higher = better, including rain & wind (green = "doesn't hurt the score", not "lots of it").
February 11–20 8/10 beach 6/10 urban
feels 9°C
(+3°C vs 1991-2020) · HCI 76/100
Day 12° · Night 6°
68% humidity 17 km/h wind 3 rain days (23h) 61h sun
sea 12°C
Thermal 3
Sky 9
Rain 8
Wind 10
Higher = better, including rain & wind (green = "doesn't hurt the score", not "lots of it").
February 21–28 7/10 beach 6/10 urban
feels 10°C
(+3°C vs 1991-2020) · HCI 70/100
Day 13° · Night 7°
66% humidity 21 km/h wind 3 rain days (26h) 50h sun
sea 12°C
Thermal 4
Sky 7
Rain 8
Wind 10
Higher = better, including rain & wind (green = "doesn't hurt the score", not "lots of it").
March 1–10 7/10 beach 6/10 urban
feels 9°C
(+1°C vs 1991-2020) · HCI 66/100
Day 12° · Night 6°
60% humidity 22 km/h wind 4 rain days (43h) 62h sun
sea 12°C
Thermal 3
Sky 8
Rain 6
Wind 10
Higher = better, including rain & wind (green = "doesn't hurt the score", not "lots of it").
March 11–20 9/10 beach 7/10 urban
feels 10°C
· HCI 85/100
Day 14° · Night 7°
59% humidity 19 km/h wind 2 rain days (20h) 70h sun
sea 12°C
Thermal 4
Sky 10
Rain 9
Wind 10
Higher = better, including rain & wind (green = "doesn't hurt the score", not "lots of it").
March 21–31 8/10 beach 7/10 urban
feels 12°C
(+1°C vs 1991-2020) · HCI 84/100
Day 15° · Night 8°
58% humidity 23 km/h wind 2 rain days (26h) 85h sun
sea 13°C
Thermal 5
Sky 10
Rain 9
Wind 9
Higher = better, including rain & wind (green = "doesn't hurt the score", not "lots of it").
April 1–10 9/10 beach 8/10 urban
feels 12°C
(−1°C vs 1991-2020) · HCI 88/100
Day 15° · Night 9°
53% humidity 20 km/h wind 2 rain days (19h) 81h sun
sea 14°C
Thermal 5
Sky 10
Rain 9
Wind 10
Higher = better, including rain & wind (green = "doesn't hurt the score", not "lots of it").
April 11–20 9/10 beach 8/10 urban
feels 14°C
· HCI 86/100
Day 17° · Night 10°
54% humidity 19 km/h wind 2 rain days (28h) 75h sun
sea 15°C
Thermal 6
Sky 9
Rain 8
Wind 10
Higher = better, including rain & wind (green = "doesn't hurt the score", not "lots of it").
April 21–30 7/10 beach 7/10 urban
feels 15°C
(−1°C vs 1991-2020) · HCI 74/100
Day 18° · Night 11°
62% humidity 20 km/h wind 4 rain days (41h) 81h sun
sea 15°C
Thermal 6
Sky 8
Rain 6
Wind 10
Higher = better, including rain & wind (green = "doesn't hurt the score", not "lots of it").
May 1–10 8/10 beach 8/10 urban
feels 18°C
· HCI 76/100
Day 20° · Night 14°
61% humidity 19 km/h wind 4 rain days (42h) 85h sun
sea 16°C
Thermal 8
Sky 8
Rain 6
Wind 10
Higher = better, including rain & wind (green = "doesn't hurt the score", not "lots of it").
May 11–20 6/10 beach 7/10 urban
feels 20°C
· HCI 65/100
Day 21° · Night 15°
64% humidity 21 km/h wind 5 rain days (58h) 82h sun
sea 17°C
Thermal 8
Sky 6
Rain 5
Wind 10
Higher = better, including rain & wind (green = "doesn't hurt the score", not "lots of it").
May 21–31 9/10 beach 9/10 urban
feels 22°C
· HCI 89/100
Day 23° · Night 16°
57% humidity 20 km/h wind 3 rain days (29h) 103h sun
sea 20°C
Thermal 9
Sky 9
Rain 8
Wind 10
Higher = better, including rain & wind (green = "doesn't hurt the score", not "lots of it").
June 1–10 7/10 beach 8/10 urban
feels 25°C
(+1°C vs 1991-2020) · HCI 75/100
Day 24° · Night 18°
🌙 14 tropical nights/yr
· peak 22 63% humidity 17 km/h wind 5 rain days (44h) 92h sun
sea 22°C
Thermal 9
Sky 8
Rain 6
Wind 10
Higher = better, including rain & wind (green = "doesn't hurt the score", not "lots of it").
June 11–20 10/10 beach 9/10 urban
feels 26°C
· HCI 95/100
Day 26° · Night 19°
🌙 14 tropical nights/yr
· peak 22 56% humidity 16 km/h wind 2 rain days (21h) 101h sun
sea 23°C
Thermal 9
Sky 10
Rain 9
Wind 10
Higher = better, including rain & wind (green = "doesn't hurt the score", not "lots of it").
June 21–30 9/10 beach 8/10 urban
feels 29°C
(+2°C vs 1991-2020) · HCI 87/100
Day 29° · Night 22°
🌙 14 tropical nights/yr
· peak 22 54% humidity 19 km/h wind 2 rain days (13h) 102h sun
sea 24°C
Thermal 8
Sky 10
Rain 9
Wind 10
Higher = better, including rain & wind (green = "doesn't hurt the score", not "lots of it").
July 1–10 9/10 beach 8/10 urban
feels 29°C
(+1°C vs 1991-2020) · HCI 86/100
Day 29° · Night 21°
· cools 8° at night
🌙 26 tropical nights/yr
· peak 30 51% humidity 18 km/h wind 2 rain days (22h) 102h sun
sea 25°C
Thermal 8
Sky 10
Rain 9
Wind 10
Higher = better, including rain & wind (green = "doesn't hurt the score", not "lots of it").
July 11–20 8/10 beach 7/10 urban
feels 30°C
(+2°C vs 1991-2020) · extreme heat caps 92 → 80/100
Day 30° · Night 23°
· warm nights (23°)
🌙 26 tropical nights/yr
· peak 30 48% humidity 19 km/h wind 2 rain days (15h) 100h sun
sea 28°C
Thermal 7
Sky 10
Rain 9
Wind 10
Higher = better, including rain & wind (green = "doesn't hurt the score", not "lots of it").
Greyed factors are scored normally — extreme heat overrides them, so a clear sky or low rain can't lift the period.
July 21–31 7/10 beach 7/10 urban
feels 31°C
(+1°C vs 1991-2020) · extreme heat caps 90 → 73/100
Day 30° · Night 23°
· warm nights (23°)
🌙 26 tropical nights/yr
· peak 30 52% humidity 18 km/h wind 2 rain days (14h) 110h sun
sea 27°C
Thermal 6
Sky 10
Rain 9
Wind 10
Higher = better, including rain & wind (green = "doesn't hurt the score", not "lots of it").
Greyed factors are scored normally — extreme heat overrides them, so a clear sky or low rain can't lift the period.
August 1–10 8/10 beach 7/10 urban
feels 30°C
· extreme heat caps 88 → 76/100
Day 30° · Night 23°
· warm nights (23°)
🌙 27 tropical nights/yr
· peak 31 51% humidity 19 km/h wind 2 rain days (27h) 97h sun
sea 27°C
Thermal 7
Sky 10
Rain 9
Wind 10
Higher = better, including rain & wind (green = "doesn't hurt the score", not "lots of it").
Greyed factors are scored normally — extreme heat overrides them, so a clear sky or low rain can't lift the period.
August 11–20 7/10 beach 7/10 urban
feels 31°C
(+2°C vs 1991-2020) · extreme heat caps 90 → 73/100
Day 30° · Night 23°
· warm nights (23°)
🌙 27 tropical nights/yr
· peak 31 51% humidity 16 km/h wind 2 rain days (12h) 95h sun
sea 27°C
Thermal 6
Sky 10
Rain 9
Wind 10
Higher = better, including rain & wind (green = "doesn't hurt the score", not "lots of it").
Greyed factors are scored normally — extreme heat overrides them, so a clear sky or low rain can't lift the period.
August 21–31 8/10 beach 8/10 urban
feels 29°C
(+1°C vs 1991-2020) · HCI 84/100
Day 29° · Night 22°
🌙 27 tropical nights/yr
· peak 31 54% humidity 19 km/h wind 2 rain days (22h) 95h sun
sea 27°C
Thermal 7
Sky 10
Rain 9
Wind 10
Higher = better, including rain & wind (green = "doesn't hurt the score", not "lots of it").
September 1–10 10/10 beach 10/10 urban
feels 27°C
(+2°C vs 1991-2020) · HCI 97/100
Day 27° · Night 20°
🌙 9 tropical nights/yr
· peak 15 53% humidity 19 km/h wind 2 rain days (14h) 86h sun
sea 26°C
Thermal 10
Sky 10
Rain 9
Wind 10
Higher = better, including rain & wind (green = "doesn't hurt the score", not "lots of it").
September 11–20 9/10 beach 9/10 urban
feels 25°C
(+2°C vs 1991-2020) · HCI 90/100
Day 25° · Night 19°
🌙 9 tropical nights/yr
· peak 15 57% humidity 20 km/h wind 3 rain days (28h) 72h sun
sea 24°C
Thermal 9
Sky 9
Rain 8
Wind 10
Higher = better, including rain & wind (green = "doesn't hurt the score", not "lots of it").
September 21–30 6/10 beach 7/10 urban
feels 22°C
(+1°C vs 1991-2020) · HCI 64/100
Day 22° · Night 16°
🌙 9 tropical nights/yr
· peak 15 63% humidity 21 km/h wind 5 rain days (60h) 73h sun
sea 23°C
Thermal 9
Sky 6
Rain 5
Wind 10
Higher = better, including rain & wind (green = "doesn't hurt the score", not "lots of it").
October 1–10 7/10 beach 7/10 urban
feels 20°C
(+1°C vs 1991-2020) · HCI 73/100
Day 21° · Night 16°
66% humidity 21 km/h wind 4 rain days (48h) 67h sun
sea 22°C
Thermal 8
Sky 7
Rain 6
Wind 10
Higher = better, including rain & wind (green = "doesn't hurt the score", not "lots of it").
October 11–20 8/10 beach 8/10 urban
feels 18°C
(+1°C vs 1991-2020) · HCI 84/100
Day 20° · Night 14°
65% humidity 18 km/h wind 2 rain days (32h) 61h sun
sea 21°C
Thermal 8
Sky 9
Rain 8
Wind 10
Higher = better, including rain & wind (green = "doesn't hurt the score", not "lots of it").
October 21–31 7/10 beach 7/10 urban
feels 19°C
(+4°C vs 1991-2020) · HCI 73/100
Day 20° · Night 14°
73% humidity 19 km/h wind 4 rain days (44h) 66h sun
sea 20°C
Thermal 7
Sky 8
Rain 6
Wind 10
Higher = better, including rain & wind (green = "doesn't hurt the score", not "lots of it").
November 1–10 8/10 beach 7/10 urban
feels 16°C
(+2°C vs 1991-2020) · HCI 76/100
Day 17° · Night 12°
71% humidity 20 km/h wind 3 rain days (35h) 56h sun
sea 19°C
Thermal 6
Sky 8
Rain 7
Wind 10
Higher = better, including rain & wind (green = "doesn't hurt the score", not "lots of it").
November 11–20 6/10 beach 6/10 urban
feels 13°C
(+2°C vs 1991-2020) · HCI 65/100
Day 15° · Night 10°
71% humidity 19 km/h wind 3 rain days (46h) 45h sun
sea 18°C
Thermal 5
Sky 6
Rain 7
Wind 10
Higher = better, including rain & wind (green = "doesn't hurt the score", not "lots of it").
November 21–30 6/10 beach 5/10 urban
feels 9°C
(−1°C vs 1991-2020) · HCI 58/100
Day 13° · Night 7°
64% humidity 21 km/h wind 4 rain days (47h) 42h sun
sea 17°C
Thermal 3
Sky 6
Rain 6
Wind 10
Higher = better, including rain & wind (green = "doesn't hurt the score", not "lots of it").
December 1–10 3/10 beach 3/10 urban
feels 8°C
· HCI 29/100
Day 12° · Night 6°
72% humidity 25 km/h wind 7 rain days (89h) 33h sun
sea 16°C
Thermal 2
Sky 2
Rain 2
Wind 9
Higher = better, including rain & wind (green = "doesn't hurt the score", not "lots of it").
December 11–20 6/10 beach 6/10 urban
feels 9°C
(+2°C vs 1991-2020) · HCI 64/100
Day 12° · Night 6°
72% humidity 18 km/h wind 2 rain days (30h) 41h sun
sea 15°C
Thermal 3
Sky 6
Rain 8
Wind 10
Higher = better, including rain & wind (green = "doesn't hurt the score", not "lots of it").
December 21–31 5/10 beach 5/10 urban
feels 10°C
(+4°C vs 1991-2020) · HCI 49/100
Day 12° · Night 7°
77% humidity 16 km/h wind 5 rain days (65h) 40h sun
sea 14°C
Thermal 3
Sky 5
Rain 4
Wind 10
Higher = better, including rain & wind (green = "doesn't hurt the score", not "lots of it").
 Private Historical Walking Tour in Rovinj
 Istrian hill top cities tour with truffle and olive oil tasting
 Full-Day Small-Group Tour in Istria
 E-bike Tour: Istrian Countryside & Parenzana
 Self Guided Secrets Tour - Explore Rovinj & Miss nothing
 Self guided walking tour of Rovinj with audio guide