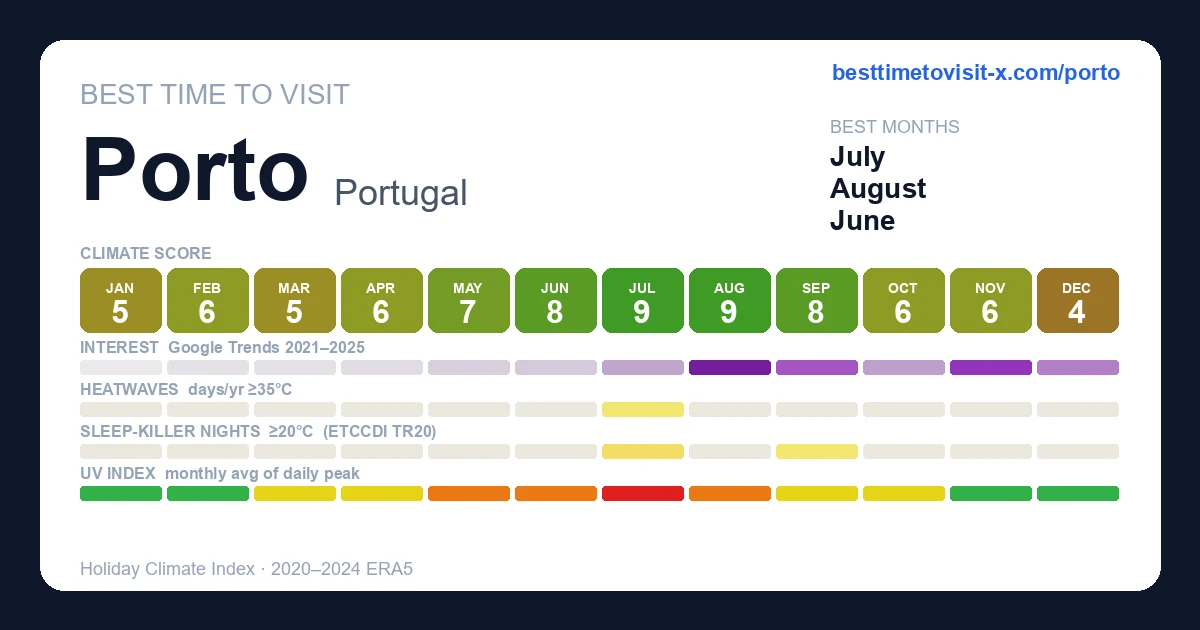
Best time to visit Porto
Re-score for me — drag the dial — every chart on the page recolours live for your heat limit 27°C
Default 27 °C is the upper edge of the Holiday Climate Index "ideal comfort" band (Scott, Rutty, Amelung & Tang, 2016). Above this, most warm-tourism travellers report measurable discomfort.
How is this scored? HCI / Steadman / CCI gate — full methodology and citations below.
Compare with another destination
Add as many as you like — stacked below the main strips above. Each row is just the recent-window score strip and (for beach destinations) sea-temperature strip.
Tours in Porto
30 top-rated tours via Viator. Booking links earn this site a commission at no cost to you.
- 1
 Port : 6 Bridges Cruise, local wine with Sunset Option
 - 2
 Porto Walking Tour, Lello Bookshop, River Cruise and Cable Car
 - 3
 Porto Progressive Dinner Tour with Eating Europe
 - 4
 Visit to Cockburn's Cellars
 - 5
 Douro Valley Private Day Trip including Boat Ride & Wine Tasting
 - 6
 Porto to Lisbon Up to 4 Stops: Aveiro, Nazare, Fatima & Obidos
 - 7
 Porto: Private Yacht Cruise with Local Wine, Snacks and 6 Bridges
 - 8
 Douro Valley and Régua Panoramic Cruise with Lunch from Porto
 - 9
 Porto: Private tour in the Douro (1 to 4 people) on a boat just for you
 - 10
 Porto Private Food and Drink Tasting Tour with Local
 - 11
 Porto: Sunset or Daytime, Charming Sailboat Cruise on the Douro River
 - 12
 Porto: Private Walking Food Tour with Tastings
 - 13
 Porto: 6 bridges tour, Douro river with 4 Port Wine tasting
 - 14
 Complete Douro Valley Wine Tour with Lunch, Wine Tastings and River Cruise
 - 15
 Douro Valley Small Group Tour: 2 Wineries, Lunch & River Cruise
 - 16
 Douro Valley Tour: 2 Vineyard Visits, River Cruise, Winery Lunch
 - 17
 Small Group Douro Valley Wine Tour with Lunch and Cruise
 - 18
 Premium Douro Valley Small-Group Tour, Wine Tasting, Lunch & Boat
 - 19
 Porto: Douro River Boat Cruise with Port Wine and Snacks
 - 20
 Authentic Food and Wine Tour in Porto by Food Lover Tour
 - 21
 Wine Venture and Boat Trip in Douro Valley from Porto
 - 22
 Port Wine Tour | 3 Cellars | 7 Tastings | 12 Participants Maximum
 - 23
 Authentic Porto Small Group Food Tour with Local Tastings
 - 24
 Douro Valley Wine Tour: 3 Vineyard Visits, Wine Tastings, Lunch
 - 25
 Douro Valley Tour - 3 Wine tastings, Lunch & river Cruise
 - 26
 Douro Valley Small-Group Wine Tour with Lunch and River Cruise
 - 27
 Douro Valley Day Trip: 2 Wineries, Private Boat & Authentic Lunch
 - 28
 Port Wine Lodges Tour Including 7 Port Wine Tastings (English)
 - 29
 3-Hour Porto Highlights on a Electric Bike Guided Tour
 - 30
 Braga & Guimarães Small Group Tour with Lunch & Tickets Included
Last refreshed 2026-05-25.
Similar climatesAveiro95% · Braga93% · Coimbra92%
Other destinations with the most-alike year-round climate to Porto (apparent temperature, rain hours, sunshine — matched within the same trip-profile). The ±N chip compares each match's typical score for the current month against Porto's. Based on the 2020-2024 climatology, not this year's actual weather.
Month-by-month
| Month | Temp °C | Feels °C | Rain days | Rain h | Rain h/day | Humidity | Wind km/h | Sun h | UV | Interest | Score |
|---|---|---|---|---|---|---|---|---|---|---|---|
| Jan | 7–14 | 11 | 11 | 178 | 16.2 | 74% | 22 | 154 | 1 | Quiet | 5 |
| Feb | 9–16 | 13 | 10 | 146 | 14.6 | 71% | 22 | 169 | 2 | Quiet | 6 |
| Mar | 9–16 | 14 | 14 | 204 | 14.6 | 69% | 23 | 204 | 4 | Quiet | 5 |
| Apr | 11–18 | 16 | 12 | 171 | 14.3 | 69% | 21 | 239 | 5 | Quiet | 6 |
| May | 13–20 | 19 | 11 | 133 | 12.1 | 68% | 22 | 276 | 6 | Quiet | 7 |
| Jun | 15–22 | 21 | 9 | 113 | 12.6 | 72% | 20 | 286 | 7 | Quiet | 8 |
| Jul | 16–24 | 25 | 4 | 36 | 9.0 | 65% | 21 | 310 | 8 | Quiet | 9 |
| Aug | 16–24 | 24 | 3 | 28 | 9.3 | 67% | 20 | 280 | 7 | Peak | 9 |
| Sep | 16–23 | 23 | 8 | 120 | 15.0 | 66% | 20 | 235 | 5 | Busy | 8 |
| Oct | 14–21 | 20 | 16 | 230 | 14.4 | 74% | 22 | 175 | 3 | Quiet | 6 |
| Nov | 11–17 | 16 | 14 | 188 | 13.4 | 75% | 21 | 152 | 2 | Busy | 6 |
| Dec | 9–15 | 12 | 16 | 237 | 14.8 | 77% | 23 | 141 | 1 | Moderate | 4 |
UV Index in Porto by Month
UV index in Porto peaks at 8 (very high) in July, dropping to 1 (low) in January. July reach very high or extreme levels — apply SPF 50+, wear a hat and protective clothing, and limit direct sun between 11:00 and 17:00.
Best months in detail
July
9/1016–24°C · 4 rain days (36h) · 310 sun hours · 65% humidity · Quiet crowd · UV 8 (very high)
August
9/1016–24°C · 3 rain days (28h) · 280 sun hours · 67% humidity · Peak crowd · UV 7 (high) · sunniest 1 in 10 days reach 8 (very high)
September
8/1016–23°C · 8 rain days (120h) · 235 sun hours · 66% humidity · Busy crowd · UV 5 (moderate) · sunniest 1 in 10 days reach 6 (high)
Every month
Show the other 9 months in detail
January
5/107–14°C (feels 11°C) · 11 rain days (178h) · 154 sun hours · 74% humidity · Quiet crowd · UV 1 (low)
February
6/109–16°C (feels 13°C) · 10 rain days (146h) · 169 sun hours · 71% humidity · Quiet crowd · UV 2 (low) · sunniest 1 in 10 days reach 3 (moderate)
March
5/109–16°C (feels 14°C) · 14 rain days (204h) · 204 sun hours · 69% humidity · Quiet crowd · UV 4 (moderate) · sunniest 1 in 10 days reach 6 (moderate)
April
6/1011–18°C (feels 16°C) · 12 rain days (171h) · 239 sun hours · 69% humidity · Quiet crowd · UV 5 (moderate) · sunniest 1 in 10 days reach 8 (high)
May
7/1013–20°C (feels 19°C) · 11 rain days (133h) · 276 sun hours · 68% humidity · Quiet crowd · UV 6 (high) · sunniest 1 in 10 days reach 8 (very high)
June
8/1015–22°C · 9 rain days (113h) · 286 sun hours · 72% humidity · Quiet crowd · UV 7 (high) · sunniest 1 in 10 days reach 9 (very high)
October
6/1014–21°C · 16 rain days (230h) · 175 sun hours · 74% humidity · Quiet crowd · UV 3 (moderate) · sunniest 1 in 10 days reach 5 (moderate)
November
6/1011–17°C (feels 16°C) · 14 rain days (188h) · 152 sun hours · 75% humidity · Busy crowd · UV 2 (low)
December
4/109–15°C (feels 12°C) · 16 rain days (237h) · 141 sun hours · 77% humidity · Moderate crowd · UV 1 (low)
Frequently asked questions about visiting Porto
When is the best time to visit Porto?
July is the highest-scoring month (9/10 on the Holiday Climate Index). Typical conditions: 16–24°C (4 rainy days). The top three months by score are July, August, September.
What is the worst time to visit Porto?
December is the lowest-scoring month (4/10). Typical conditions: 9–15°C (16 rainy days).
When are crowds lowest in Porto?
Search-interest seasonality (Google Trends 2021-2025) is lowest in January and peaks in August. Interest tracks both in-trip visitors and lead-time planners, so treat it as a "destination is on people's minds" signal rather than literal arrivals.
Which months in Porto have good weather but fewer tourists?
July (climate 9/10, crowd index 34) and June (climate 8/10, crowd index 17) — shoulder months with above-average climate and below-median search-interest. Often the best value-for-weather trade.
What is the UV index in Porto by month?
UV peaks at 8 (very high) in July and is lowest in January at 1 (low). Monthly peak values: Jan 1, Feb 2, Mar 4, Apr 5, May 6, Jun 7, Jul 8, Aug 7, Sep 5, Oct 3, Nov 2, Dec 1. July reach very high or extreme levels — apply SPF 50+, wear a hat and protective clothing, and limit direct sun between 11:00 and 17:00.
What is the UV index in Porto in July?
July is the peak UV month in Porto, with a daily-peak UV index of 8 (very high). At this level, sunburn can occur in under 20 minutes on unprotected fair skin. Apply SPF 50+, wear protective clothing and a hat, and avoid direct midday sun (11:00–17:00).
How high can UV get in Porto on the sunniest days?
Most days look like the monthly average, but on the sunniest ~1 in 10 days UV climbs higher than the mean suggests. June is the worst case: typical days average UV 7 (high), but the top 10% of days reach UV 9 (very high) — and even higher. Months where the sunniest days routinely exceed the typical reading: February, March, April, May, June, August, September, October. Plan sun protection for the worst case, not the average.
Is air quality in Porto bad for travelers?
PM2.5 (fine-particle pollution) exceeds the WHO sensitive-group guideline (15 µg/m³) in 10 months: January, February, March, April, June, August, September, October, November, December. The worst month is February with a typical-day mean of 15 µg/m³ (moderate); on the worst 10% of days PM2.5 reaches 29 µg/m³ (unhealthy) and higher. People with asthma, heart conditions, or sensitive children may want to avoid these months or limit outdoor activity. Source: CAMS via Open-Meteo.