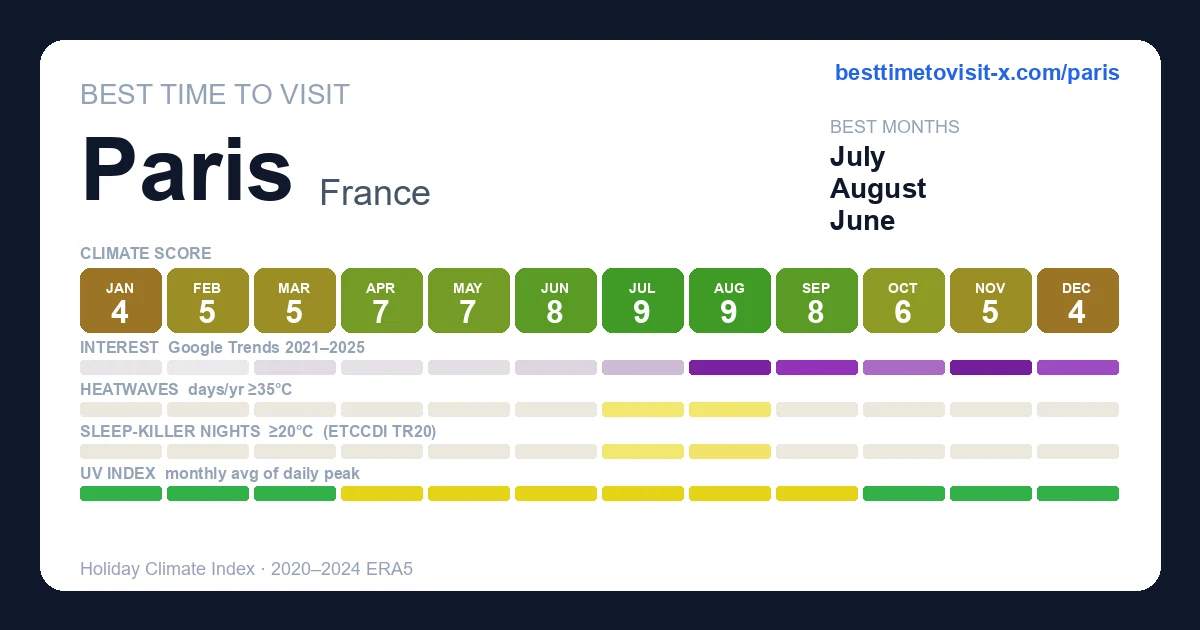
Best time to visit Paris
Re-score for me — drag the dial — every chart on the page recolours live for your heat limit 27°C
Default 27 °C is the upper edge of the Holiday Climate Index "ideal comfort" band (Scott, Rutty, Amelung & Tang, 2016). Above this, most warm-tourism travellers report measurable discomfort.
How is this scored? HCI / Steadman / CCI gate — full methodology and citations below.
Compare with another destination
Add as many as you like — stacked below the main strips above. Each row is just the recent-window score strip and (for beach destinations) sea-temperature strip.
Tours in Paris
30 top-rated tours via Viator. Booking links earn this site a commission at no cost to you.
- 1
 Louvre Museum Premium Guided Tour 6 GUESTS MAX Entry Included
 - 2
 Paris: Your Perfect Private Customized Day Tour–Half or Full Day
 - 3
 Orsay Museum Premium Guided Tour 6 GUESTS MAX with Entry Included
 - 4
 Paris Food Tour: Eat Like a Local with Cheeses, Wines & Secrets
 - 5
 Eiffel Tower Elevator Tour with Optional Summit & Cruise Access
 - 6
 Paris Catacombs Guided Tour with Exclusive Access to Secret Areas
 - 7
 Early Access Paris Notre Dame Cathedral Walking Tour
 - 8
 Top Private Cruises in Paris with French Champagne and surprises
 - 9
 Mont Saint Michel Day Trip from Paris with English Speaking Guide
 - 10
 Louvre Museum Access Guided Tour with Mona Lisa
 - 11
 Giverny Monet's Home & Versailles Palace Day Trip from Paris
 - 12
 From Paris: Versailles Palace Guided Tour with Gardens Access
 - 13
 Golf Cart in Paris - Private Guided City Tour - Pickup Included
 - 14
 Paris Crazy Horse Cabaret Show with Beverages including Champagne
 - 15
 Giverny Small-Group Minivan with Hotel Pickup or Meeting Point
 - 16
 Paris Private Flexible Duration Guided Tour on a Vintage Sidecar
 - 17
 Normandy D-Day Small-Group Day Trip with Omaha Beach, Cemetery & Cider Tasting
 - 18
 Private Arrival Transfer: CDG/Orly to Paris Hotel
 - 19
 Eiffel Tower Access up to 2nd Floor or Summit with Cruise Option
 - 20
 Normandy D-Day Sites & Cemetery Day Trip from Paris with Lunch
 - 21
 Paris in A Day: Louvre, Eiffel Tower, Notre Dame & Seine Cruise
 - 22
 Paris Croissant Small-Group Baking Class with a Chef
 - 23
 Paris Le Marais Food Tour With 10+ Tastings, Cheese, Wine & More
 - 24
 Paris Top Sights Half Day Walking Tour with a Fun Guide
 - 25
 The Musee d Orsay Guided Tour Orsay Museum Semi Private 6ppl Max
 - 26
 Paris Montmartre Guided Food Tour: A Full Meal by Do Eat Better
 - 27
 Louvre Museum Essential Guided Tour Semi Private 6 GUESTS MAX
 - 28
 Devour Paris Ultimate Food Tour
 - 29
 Versailles Bike Tour with Market, Gardens & Guided Palace Tour
 - 30
 Champagne Day Trip with 6 Tastings, Reims and Winery from Paris
Last refreshed 2026-05-25.
Similar climatesVersailles98% · Reims96% · Lille94%
Other destinations with the most-alike year-round climate to Paris (apparent temperature, rain hours, sunshine — matched within the same trip-profile). The ±N chip compares each match's typical score for the current month against Paris's. Based on the 2020-2024 climatology, not this year's actual weather.
Month-by-month
| Month | Temp °C | Feels °C | Rain days | Rain h | Rain h/day | Humidity | Wind km/h | Sun h | UV | Interest | Score |
|---|---|---|---|---|---|---|---|---|---|---|---|
| Jan | 2–8 | 4 | 12 | 126 | 10.5 | 82% | 21 | 84 | 1 | Quiet | 4 |
| Feb | 4–11 | 7 | 12 | 125 | 10.4 | 74% | 24 | 104 | 1 | Quiet | 5 |
| Mar | 4–13 | 10 | 14 | 145 | 10.4 | 66% | 21 | 173 | 2 | Quiet | 5 |
| Apr | 6–16 | 13 | 10 | 113 | 11.3 | 58% | 20 | 224 | 4 | Quiet | 7 |
| May | 10–19 | 17 | 13 | 142 | 10.9 | 59% | 19 | 256 | 5 | Quiet | 7 |
| Jun | 14–24 | 23 | 13 | 131 | 10.1 | 58% | 17 | 266 | 6 | Quiet | 8 |
| Jul | 15–25 | 25 | 9 | 106 | 11.8 | 54% | 18 | 270 | 5 | Quiet | 9 |
| Aug | 16–25 | 25 | 11 | 105 | 9.5 | 56% | 18 | 248 | 5 | Peak | 9 |
| Sep | 13–22 | 22 | 10 | 110 | 11.0 | 63% | 17 | 206 | 4 | Busy | 8 |
| Oct | 10–17 | 16 | 14 | 145 | 10.4 | 74% | 20 | 149 | 2 | Moderate | 6 |
| Nov | 6–12 | 9 | 11 | 103 | 9.4 | 81% | 19 | 107 | 1 | Peak | 5 |
| Dec | 4–9 | 5 | 15 | 146 | 9.7 | 85% | 20 | 67 | 1 | Busy | 4 |
UV Index in Paris by Month
UV index in Paris peaks at 6 (moderate) in June, dropping to 1 (low) in January.
Best months in detail
July
9/1015–25°C · 9 rain days (106h) · 270 sun hours · 54% humidity · Quiet crowd · UV 5 (moderate) · sunniest 1 in 10 days reach 7 (high)
August
9/1016–25°C · 11 rain days (105h) · 248 sun hours · 56% humidity · Peak crowd · UV 5 (moderate) · sunniest 1 in 10 days reach 7 (high)
September
8/1013–22°C · 10 rain days (110h) · 206 sun hours · 63% humidity · Busy crowd · UV 4 (moderate)
Every month
Show the other 9 months in detail
January
4/102–8°C (feels 4°C) · 12 rain days (126h) · 84 sun hours · 82% humidity · Quiet crowd · UV 1 (low)
February
5/104–11°C (feels 7°C) · 12 rain days (125h) · 104 sun hours · 74% humidity · Quiet crowd · UV 1 (low)
March
5/104–13°C (feels 10°C) · 14 rain days (145h) · 173 sun hours · 66% humidity · Quiet crowd · UV 2 (low) · sunniest 1 in 10 days reach 4 (moderate)
April
7/106–16°C (feels 13°C) · 10 rain days (113h) · 224 sun hours · 58% humidity · Quiet crowd · UV 4 (moderate)
May
7/1010–19°C (feels 17°C) · 13 rain days (142h) · 256 sun hours · 59% humidity · Quiet crowd · UV 5 (moderate) · sunniest 1 in 10 days reach 7 (high)
June
8/1014–24°C · 13 rain days (131h) · 266 sun hours · 58% humidity · Quiet crowd · UV 6 (moderate) · sunniest 1 in 10 days reach 8 (high)
October
6/1010–17°C (feels 16°C) · 14 rain days (145h) · 149 sun hours · 74% humidity · Moderate crowd · UV 2 (low) · sunniest 1 in 10 days reach 3 (moderate)
November
5/106–12°C (feels 9°C) · 11 rain days (103h) · 107 sun hours · 81% humidity · Peak crowd · UV 1 (low)
December
4/104–9°C (feels 5°C) · 15 rain days (146h) · 67 sun hours · 85% humidity · Busy crowd · UV 1 (low)
Comparisons people search for
Pairs validated by Google Autocomplete demand — only pairs people actually compare.
- Paris vs Rome
- Paris vs Berlin
- Paris vs Edinburgh
- Paris vs Kyoto
- Paris vs Madrid
- Paris vs Rio de Janeiro
- Paris vs Dubai
- Paris vs Tokyo
- Paris vs Venice
- Paris vs New York City
- Paris vs London
- Paris vs Beijing
- Paris vs Buenos Aires
- Paris vs Montreal
- Paris vs Athens
- Paris vs New Orleans
- Paris vs Santorini
- Paris vs Vancouver
- Paris vs Quebec City
- Paris vs Glasgow
- Paris vs Las Vegas
Frequently asked questions about visiting Paris
When is the best time to visit Paris?
July is the highest-scoring month (9/10 on the Holiday Climate Index). Typical conditions: 15–25°C (9 rainy days). The top three months by score are July, August, September.
What is the worst time to visit Paris?
December is the lowest-scoring month (4/10). Typical conditions: 4–9°C (15 rainy days).
When are crowds lowest in Paris?
Search-interest seasonality (Google Trends 2021-2025) is lowest in February and peaks in November. Interest tracks both in-trip visitors and lead-time planners, so treat it as a "destination is on people's minds" signal rather than literal arrivals.
Which months in Paris have good weather but fewer tourists?
July (climate 9/10, crowd index 24) and June (climate 8/10, crowd index 11) — shoulder months with above-average climate and below-median search-interest. Often the best value-for-weather trade.
What is the UV index in Paris by month?
UV peaks at 6 (moderate) in June and is lowest in January at 1 (low). Monthly peak values: Jan 1, Feb 1, Mar 2, Apr 4, May 5, Jun 6, Jul 5, Aug 5, Sep 4, Oct 2, Nov 1, Dec 1.
What is the UV index in Paris in June?
June is the peak UV month in Paris, with a daily-peak UV index of 6 (moderate). Standard sun protection — sunglasses and light SPF — is recommended.
How high can UV get in Paris on the sunniest days?
Most days look like the monthly average, but on the sunniest ~1 in 10 days UV climbs higher than the mean suggests. June is the worst case: typical days average UV 6 (moderate), but the top 10% of days reach UV 8 (high) — and even higher. Months where the sunniest days routinely exceed the typical reading: March, May, June, July, August, October. Plan sun protection for the worst case, not the average.
Is air quality in Paris bad for travelers?
PM2.5 (fine-particle pollution) exceeds the WHO sensitive-group guideline (15 µg/m³) in 7 months: January, February, March, April, October, November, December. The worst month is February with a typical-day mean of 15 µg/m³ (moderate); on the worst 10% of days PM2.5 reaches 27 µg/m³ (unhealthy) and higher. People with asthma, heart conditions, or sensitive children may want to avoid these months or limit outdoor activity. Source: CAMS via Open-Meteo.