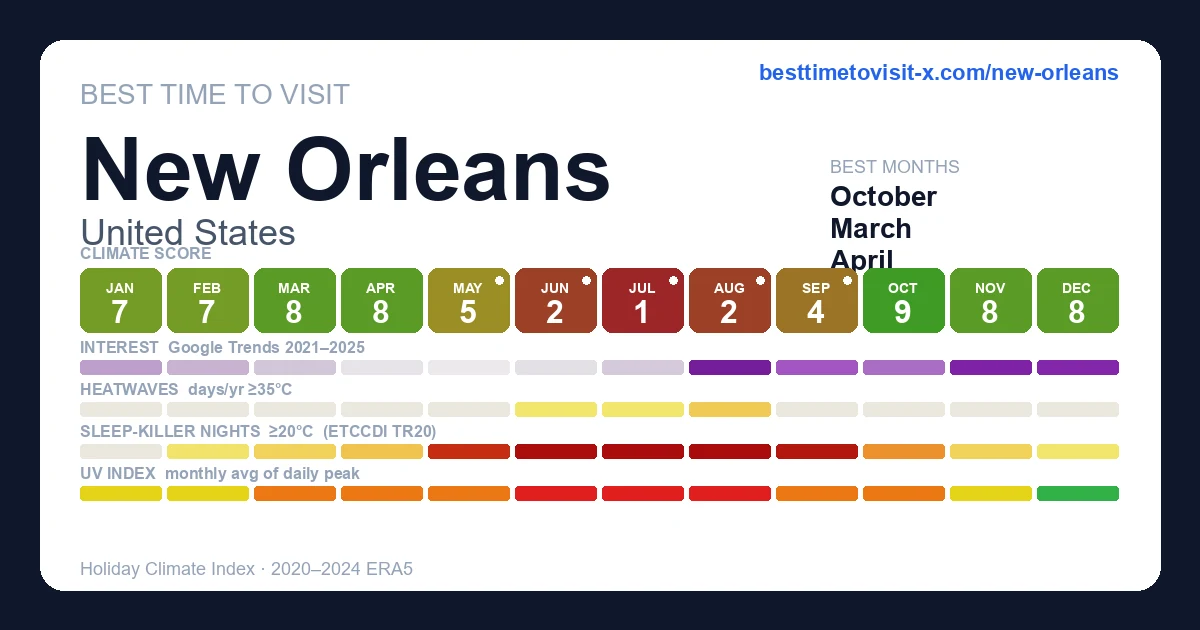
Best time to visit New Orleans
Re-score for me — drag the dial — every chart on the page recolours live for your heat limit 27°C
Default 27 °C is the upper edge of the Holiday Climate Index "ideal comfort" band (Scott, Rutty, Amelung & Tang, 2016). Above this, most warm-tourism travellers report measurable discomfort.
Greyed factors are scored normally — extreme heat overrides them, so a clear sky or low rain can't lift the period.
Greyed factors are scored normally — extreme heat overrides them, so a clear sky or low rain can't lift the period.
Greyed factors are scored normally — extreme heat overrides them, so a clear sky or low rain can't lift the period.
Greyed factors are scored normally — extreme heat overrides them, so a clear sky or low rain can't lift the period.
Greyed factors are scored normally — extreme heat overrides them, so a clear sky or low rain can't lift the period.
Greyed factors are scored normally — extreme heat overrides them, so a clear sky or low rain can't lift the period.
Greyed factors are scored normally — extreme heat overrides them, so a clear sky or low rain can't lift the period.
Greyed factors are scored normally — extreme heat overrides them, so a clear sky or low rain can't lift the period.
Greyed factors are scored normally — extreme heat overrides them, so a clear sky or low rain can't lift the period.
Greyed factors are scored normally — extreme heat overrides them, so a clear sky or low rain can't lift the period.
Greyed factors are scored normally — extreme heat overrides them, so a clear sky or low rain can't lift the period.
Greyed factors are scored normally — extreme heat overrides them, so a clear sky or low rain can't lift the period.
Greyed factors are scored normally — extreme heat overrides them, so a clear sky or low rain can't lift the period.
Greyed factors are scored normally — extreme heat overrides them, so a clear sky or low rain can't lift the period.
Greyed factors are scored normally — extreme heat overrides them, so a clear sky or low rain can't lift the period.
Greyed factors are scored normally — extreme heat overrides them, so a clear sky or low rain can't lift the period.
Greyed factors are scored normally — extreme heat overrides them, so a clear sky or low rain can't lift the period.
Greyed factors are scored normally — extreme heat overrides them, so a clear sky or low rain can't lift the period.
Greyed factors are scored normally — extreme heat overrides them, so a clear sky or low rain can't lift the period.
Greyed factors are scored normally — extreme heat overrides them, so a clear sky or low rain can't lift the period.
Greyed factors are scored normally — extreme heat overrides them, so a clear sky or low rain can't lift the period.
Greyed factors are scored normally — extreme heat overrides them, so a clear sky or low rain can't lift the period.
Greyed factors are scored normally — extreme heat overrides them, so a clear sky or low rain can't lift the period.
Greyed factors are scored normally — extreme heat overrides them, so a clear sky or low rain can't lift the period.
Greyed factors are scored normally — extreme heat overrides them, so a clear sky or low rain can't lift the period.
Greyed factors are scored normally — extreme heat overrides them, so a clear sky or low rain can't lift the period.
Greyed factors are scored normally — extreme heat overrides them, so a clear sky or low rain can't lift the period.
Greyed factors are scored normally — extreme heat overrides them, so a clear sky or low rain can't lift the period.
Greyed factors are scored normally — extreme heat overrides them, so a clear sky or low rain can't lift the period.
Greyed factors are scored normally — extreme heat overrides them, so a clear sky or low rain can't lift the period.
Greyed factors are scored normally — extreme heat overrides them, so a clear sky or low rain can't lift the period.
Greyed factors are scored normally — extreme heat overrides them, so a clear sky or low rain can't lift the period.
Greyed factors are scored normally — extreme heat overrides them, so a clear sky or low rain can't lift the period.
Greyed factors are scored normally — extreme heat overrides them, so a clear sky or low rain can't lift the period.
Greyed factors are scored normally — extreme heat overrides them, so a clear sky or low rain can't lift the period.
Greyed factors are scored normally — extreme heat overrides them, so a clear sky or low rain can't lift the period.
How is this scored? HCI / Steadman / CCI gate — full methodology and citations below.
Compare with another destination
Add as many as you like — stacked below the main strips above. Each row is just the recent-window score strip and (for beach destinations) sea-temperature strip.
Tours in New Orleans
30 top-rated tours via Viator. Booking links earn this site a commission at no cost to you.
- 1
 New Orleans French Quarter and More Carriage Ride
 - 2
 New Orleans Zipline Swamp Tour
 - 3
 New Orleans Paranormal Society Ghost Hunt Experience
 - 4
 Large Airboat Swamp Tour with Transportation from New Orleans
 - 5
 New Orleans Private Carriage Tour of the French Quarter
 - 6
 Swamp Boat Ride and Oak Alley Plantation Tour from New Orleans
 - 7
 Swamp Boat Ride and Whitney Plantation Tour from New Orleans
 - 8
 French Quarter Shrimp Boil & Live Music
 - 9
 Small-Group Manchac Swamp Kayak Tour with Local Guide
 - 10
 New Orleans Swamp Tour Boat Adventure
 - 11
 New Orleans Swamp Tour Boat Adventure with Transportation
 - 12
 New Orleans Swamp and Bayou Boat Tour with Transportation
 - 13
 New Orleans Food Walking Tour of the French Quarter with Small-Group Option
 - 14
 New Orleans Food and History Walking Tour
 - 15
 Small-Group Airboat Swamp Tour with Downtown New Orleans Pickup
 - 16
 New Orleans Adults-Only True Crime and Ghost Walking Tour
 - 17
 The National WWII Museum Admission Ticket New Orleans
 - 18
 New Orleans Small-Group Airboat Swamp Tour
 - 19
 New Orleans Demonstration Cooking Class with Meal
 - 20
 French Quarter Historical Sights and Stories Walking Tour
 - 21
 New Orleans Hands-On Cooking Class with Meal
 - 22
 New Orleans Small-Group Garden District Walking Tour
 - 23
 French Quarter Small-Group Cocktail and Foodie Crawl
 - 24
 French Quarter Food Tour: 5 Classic Bites & NOLA Stories
 - 25
 New Orleans Self-Transport Swamp and Bayou Boat Tour
 - 26
 New Orleans Cemetery Walking Tour
 - 27
 New Orleans Cocktail History Walking Tour in the French Quarter
 - 28
 French Quarter walking Food Tour Famous Flavors of New Orleans
 - 29
 New Orleans Cocktail and Food History Tour
 - 30
 New Orleans Small-Group City Tour by Van
Last refreshed 2026-05-25.
Similar climatesSavannah91% · Atlanta88% · Hsinchu88%
Other destinations with the most-alike year-round climate to New Orleans (apparent temperature, rain hours, sunshine — matched within the same trip-profile). The ±N chip compares each match's typical score for the current month against New Orleans's. Based on the 2020-2024 climatology, not this year's actual weather.
Month-by-month
| Month | Temp °C | Feels °C | Rain days | Rain h | Rain h/day | Humidity | Wind km/h | Sun h | UV | Interest | Score |
|---|---|---|---|---|---|---|---|---|---|---|---|
| Jan | 9–17 | 15 | 13 | 116 | 8.9 | 70% | 23 | 174 | 3 | Quiet | 7 |
| Feb | 11–19 | 17 | 11 | 116 | 10.5 | 70% | 24 | 167 | 5 | Quiet | 7 |
| Mar | 15–23 | 22 | 13 | 139 | 10.7 | 65% | 23 | 216 | 6 | Quiet | 8 |
| Apr | 17–25 | 24 | 12 | 121 | 10.1 | 60% | 23 | 222 | 7 | Quiet | 8 |
| May | 21–29 | 30 | 15 | 146 | 9.7 | 62% | 20 | 256 | 8 | Quiet | 5 |
| Jun | 24–31 | 35 | 18 | 190 | 10.6 | 67% | 19 | 255 | 9 | Quiet | 2 |
| Jul | 25–31 | 36 | 24 | 242 | 10.1 | 74% | 15 | 238 | 9 | Quiet | 1 |
| Aug | 26–32 | 36 | 17 | 187 | 11.0 | 67% | 17 | 237 | 9 | Peak | 2 |
| Sep | 24–29 | 32 | 16 | 179 | 11.2 | 68% | 18 | 221 | 7 | Busy | 4 |
| Oct | 19–26 | 27 | 7 | 82 | 11.7 | 62% | 19 | 229 | 6 | Moderate | 9 |
| Nov | 15–21 | 21 | 10 | 105 | 10.5 | 68% | 20 | 180 | 4 | Peak | 8 |
| Dec | 12–18 | 17 | 9 | 88 | 9.8 | 72% | 20 | 183 | 3 | Peak | 8 |
UV Index in New Orleans by Month
UV index in New Orleans peaks at 9 (very high) in June, dropping to 3 (low) in December. June, July, August reach very high or extreme levels — apply SPF 50+, wear a hat and protective clothing, and limit direct sun between 11:00 and 17:00.
Best months in detail
October
9/1019–26°C · 7 rain days (82h) · 229 sun hours · 62% humidity · Moderate crowd · UV 6 (high)
April
8/1017–25°C · 12 rain days (121h) · 222 sun hours · 60% humidity · Quiet crowd · UV 7 (high) · sunniest 1 in 10 days reach 9 (very high)
November
8/1015–21°C · 10 rain days (105h) · 180 sun hours · 68% humidity · Peak crowd · UV 4 (moderate)
Every month
Show the other 9 months in detail
January
7/109–17°C (feels 15°C) · 13 rain days (116h) · 174 sun hours · 70% humidity · Quiet crowd · UV 3 (moderate)
February
7/1011–19°C (feels 17°C) · 11 rain days (116h) · 167 sun hours · 70% humidity · Quiet crowd · UV 5 (moderate) · sunniest 1 in 10 days reach 7 (high)
March
8/1015–23°C · 13 rain days (139h) · 216 sun hours · 65% humidity · Quiet crowd · UV 6 (high) · sunniest 1 in 10 days reach 8 (very high)
May
5/1021–29°C (feels 30°C) · 15 rain days (146h) · 256 sun hours · 62% humidity · Quiet crowd · UV 8 (high) · sunniest 1 in 10 days reach 10 (very high)
June
2/1024–31°C (feels 35°C) · 18 rain days (190h) · 255 sun hours · 67% humidity · Quiet crowd · UV 9 (very high) · sunniest 1 in 10 days reach 10 (very high)
July
1/1025–31°C (feels 36°C) · 24 rain days (242h) · 238 sun hours · 74% humidity · Quiet crowd · UV 9 (very high) · sunniest 1 in 10 days reach 10 (very high)
August
2/1026–32°C (feels 36°C) · 17 rain days (187h) · 237 sun hours · 67% humidity · Peak crowd · UV 9 (very high) · sunniest 1 in 10 days reach 10 (very high)
September
4/1024–29°C (feels 32°C) · 16 rain days (179h) · 221 sun hours · 68% humidity · Busy crowd · UV 7 (high) · sunniest 1 in 10 days reach 9 (very high)
December
8/1012–18°C (feels 17°C) · 9 rain days (88h) · 183 sun hours · 72% humidity · Peak crowd · UV 3 (low) · sunniest 1 in 10 days reach 4 (moderate)
Comparisons people search for
Pairs validated by Google Autocomplete demand — only pairs people actually compare.
Frequently asked questions about visiting New Orleans
When is the best time to visit New Orleans?
October is the highest-scoring month (9/10 on the Holiday Climate Index). Typical conditions: 19–26°C (7 rainy days). The top three months by score are October, April, November.
What is the worst time to visit New Orleans?
July is the lowest-scoring month (1/10, capped by extreme heat). Typical conditions: 25–31°C (24 rainy days).
Is New Orleans too hot in summer?
5 months (May, June, July, August, September) trip the heat deal-breaker in our scoring: apparent temperature crosses the comfort cap, so even with clear skies and low rain the score is held down. Plan around it if heat tolerance is low.
When are crowds lowest in New Orleans?
Search-interest seasonality (Google Trends 2021-2025) is lowest in May and peaks in August. Interest tracks both in-trip visitors and lead-time planners, so treat it as a "destination is on people's minds" signal rather than literal arrivals.
Which months in New Orleans have good weather but fewer tourists?
March (climate 8/10, crowd index 19) and April (climate 8/10, crowd index 3) — shoulder months with above-average climate and below-median search-interest. Often the best value-for-weather trade.
What is the UV index in New Orleans by month?
UV peaks at 9 (very high) in June and is lowest in December at 3 (low). Monthly peak values: Jan 3, Feb 5, Mar 6, Apr 7, May 8, Jun 9, Jul 9, Aug 9, Sep 7, Oct 6, Nov 4, Dec 3. June, July, August reach very high or extreme levels — apply SPF 50+, wear a hat and protective clothing, and limit direct sun between 11:00 and 17:00.
What is the UV index in New Orleans in June?
June is the peak UV month in New Orleans, with a daily-peak UV index of 9 (very high). At this level, sunburn can occur in under 20 minutes on unprotected fair skin. Apply SPF 50+, wear protective clothing and a hat, and avoid direct midday sun (11:00–17:00).
How high can UV get in New Orleans on the sunniest days?
Most days look like the monthly average, but on the sunniest ~1 in 10 days UV climbs higher than the mean suggests. June is the worst case: typical days average UV 9 (very high), but the top 10% of days reach UV 10 (very high) — and even higher. Months where the sunniest days routinely exceed the typical reading: February, March, April, May, June, July, August, September, December. Plan sun protection for the worst case, not the average.
Is air quality in New Orleans bad for travelers?
PM2.5 (fine-particle pollution) exceeds the WHO sensitive-group guideline (15 µg/m³) in 4 months: May, June, July, August. The worst month is July with a typical-day mean of 16 µg/m³ (unhealthy for sensitive); on the worst 10% of days PM2.5 reaches 24 µg/m³ (unhealthy for sensitive) and higher. People with asthma, heart conditions, or sensitive children may want to avoid these months or limit outdoor activity. Source: CAMS via Open-Meteo.